
International Journal of
Reproductive Biomedicine
Wed, Apr 24, 2024
[Archive]
Volume 18, Issue 5 (May 2020)
IJRM 2020, 18(5): 375-384 |
Back to browse issues page


![]()
![]()
![]()
Download citation:
BibTeX | RIS | EndNote | Medlars | ProCite | Reference Manager | RefWorks
Send citation to:


BibTeX | RIS | EndNote | Medlars | ProCite | Reference Manager | RefWorks
Send citation to:
Askari M, Kordi Tamandani D M, almadani N, Totonchi M. Strategies for whole-exome sequencing analysis in a case series study of familial male infertility. IJRM 2020; 18 (5) :375-384
URL: http://ijrm.ir/article-1-1302-en.html
URL: http://ijrm.ir/article-1-1302-en.html


1- Department of Biology, Sistan and Baluchestan University, Zahedan, Iran.
2- Department of Biology, Sistan and Baluchestan University, Zahedan, Iran. , dor_kordi@science.usb.ac.ir
3- Department of Genetics, Reproductive Biomedicine Research Center, Royan Institute for Reproductive Biomedicine, ACECR, Tehran, Iran.
4- Department of Genetics, Reproductive Biomedicine Research Center, Royan Institute for Reproductive Biomedicine, ACECR, Tehran, Iran. Department of Stem Cells and Developmental Biology, Cell Science Research Center, Royan Institute for Stem Cell Biology and Technology, ACECR, Tehran, Iran.
Full-Text [PDF 903 kb]
(771 Downloads)
| Abstract (HTML) (2099 Views)
Approximately 30%-40% infertility cases in men with unknown etiology may be associated with genetic factors (6). The high proportion of idiopathic infertility in males is attributed to the limitations of traditional gene identification techniques, such as the Sanger sequencing. The most notable disadvantages of these approaches include length of time, low throughput data, and a broad region for candidate genes. Most of these limitations have been addressed by next-generation sequencing (NGS) (7).
The NGS approach, or whole-exome sequencing (WES), is a powerful and unbiased tool for identifying genetic variation by capturing genome coding regions (8). WES covers a region of approximately 1%-1.5% of the human genome, where approximately 85% of causative mutations are located. Overlap-, de novo-, extreme phenotypes-, and familial-based are the four main strategies for WES analysis. Of these, family-based WES is an efficient method of identifying potential causal variants (9). This approach led to the identification of causal variants that traditional methods had failed to detect in several pedigrees (10). The WES specialist can generate large amounts of data and, consequently, be of benefit to clinics. However, excluding the called variations across the whole-exome remains an issue, and it is not reasonable to verify all types of candidates via the Sanger sequencing (11, 12). Indeed, prioritizing the best candidate pathogenic variants is the main challenge. Many previous studies have focused on the family-based strategy to increase the efficiency of discovering candidate genes and reducing the number of private variants (13).
The purpose of this study was to illustrate the basic familial framework for the purpose of identifying genes that relate to male infertility. To this end, we studied seven cases in two families. In family I, we sequenced two affected members and their parents to filter out inherited variants. In family II, we focused on the most distantly related family members to reduce shared benign variations. The advantage of this approach, by sequencing non-affected siblings, is that not many private variations were missed.
2. Case presentation
2.1 Human subjects and DNA samples
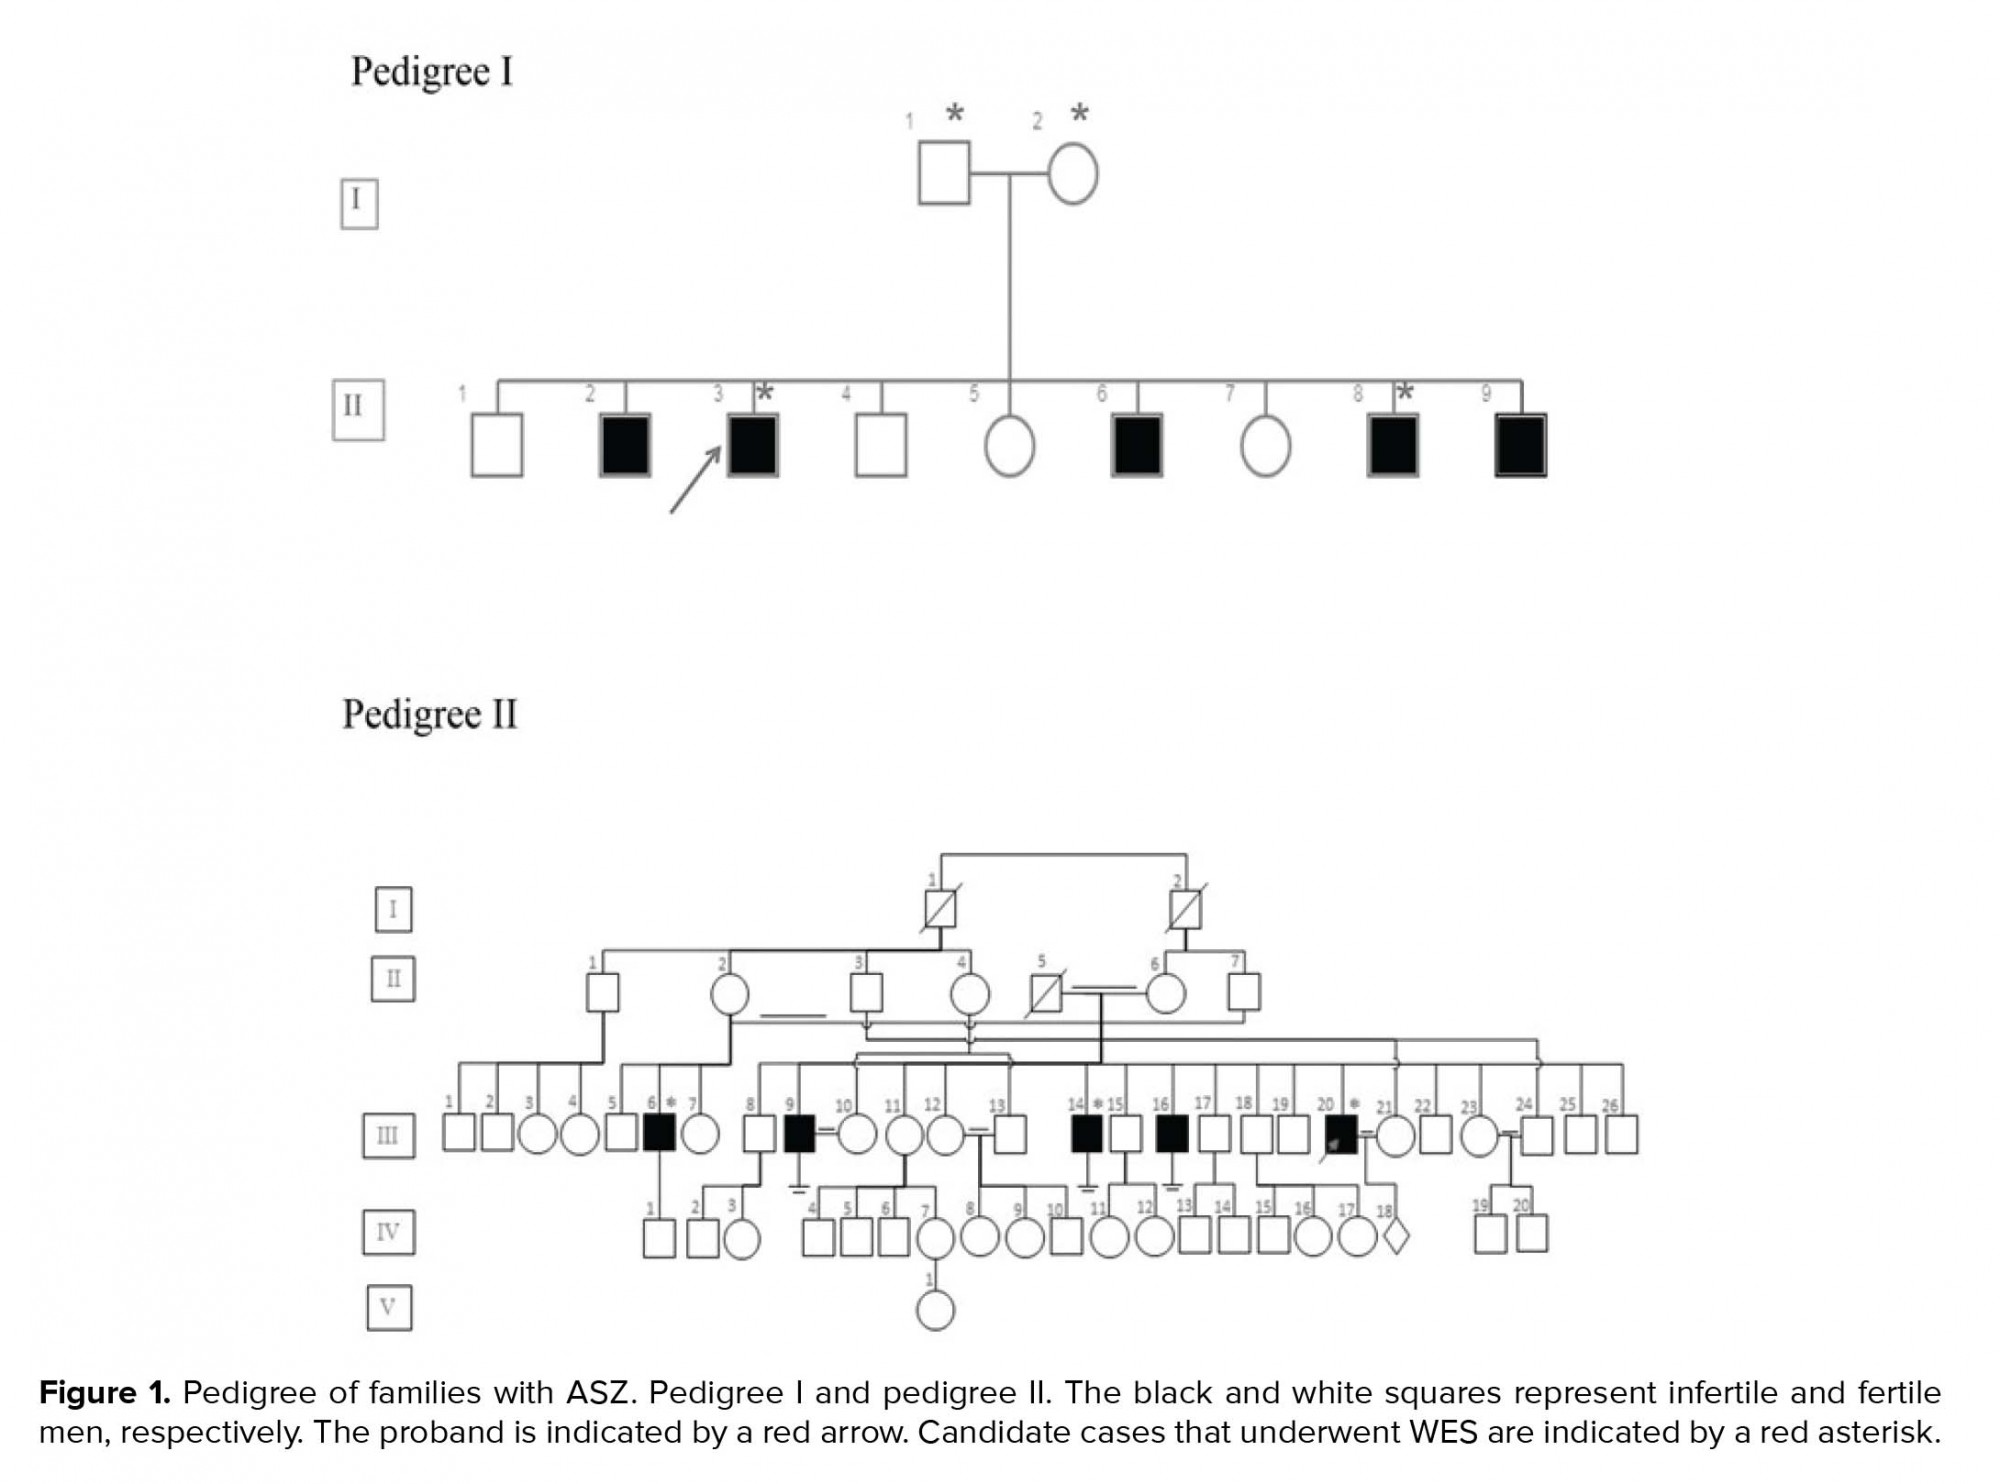
In this case series study, we examined seven cases from two unrelated families (Figure 1). DNA was extracted from the peripheral blood leukocyte using salting out methods.. The quality of the DNA was checked using an agarose gel and NanoDrop analysis.
2.8. Ethical consideration
As a first step, written informed consent for genetic studies was obtained from subjects. This case series study was conducted in accordance with the protocols approved by the Institutional Review Board of the Royan Institute Research Center and the Royan Ethics Committee, Tehran, Iran.
2.9. Bioinformatics tools
3.1. WES Run Statistics and alignment results
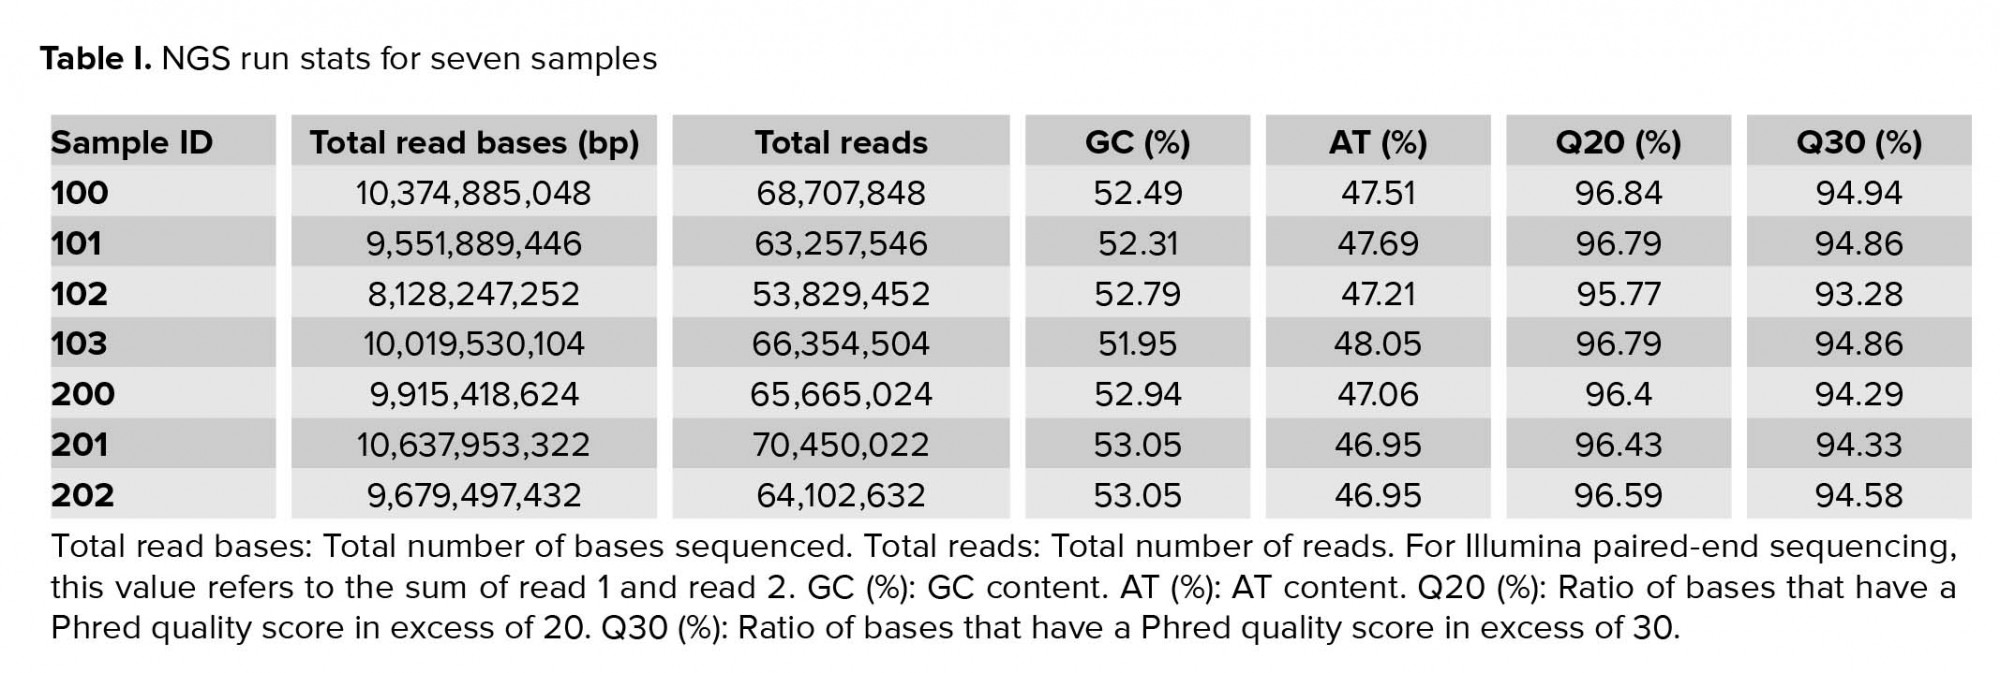
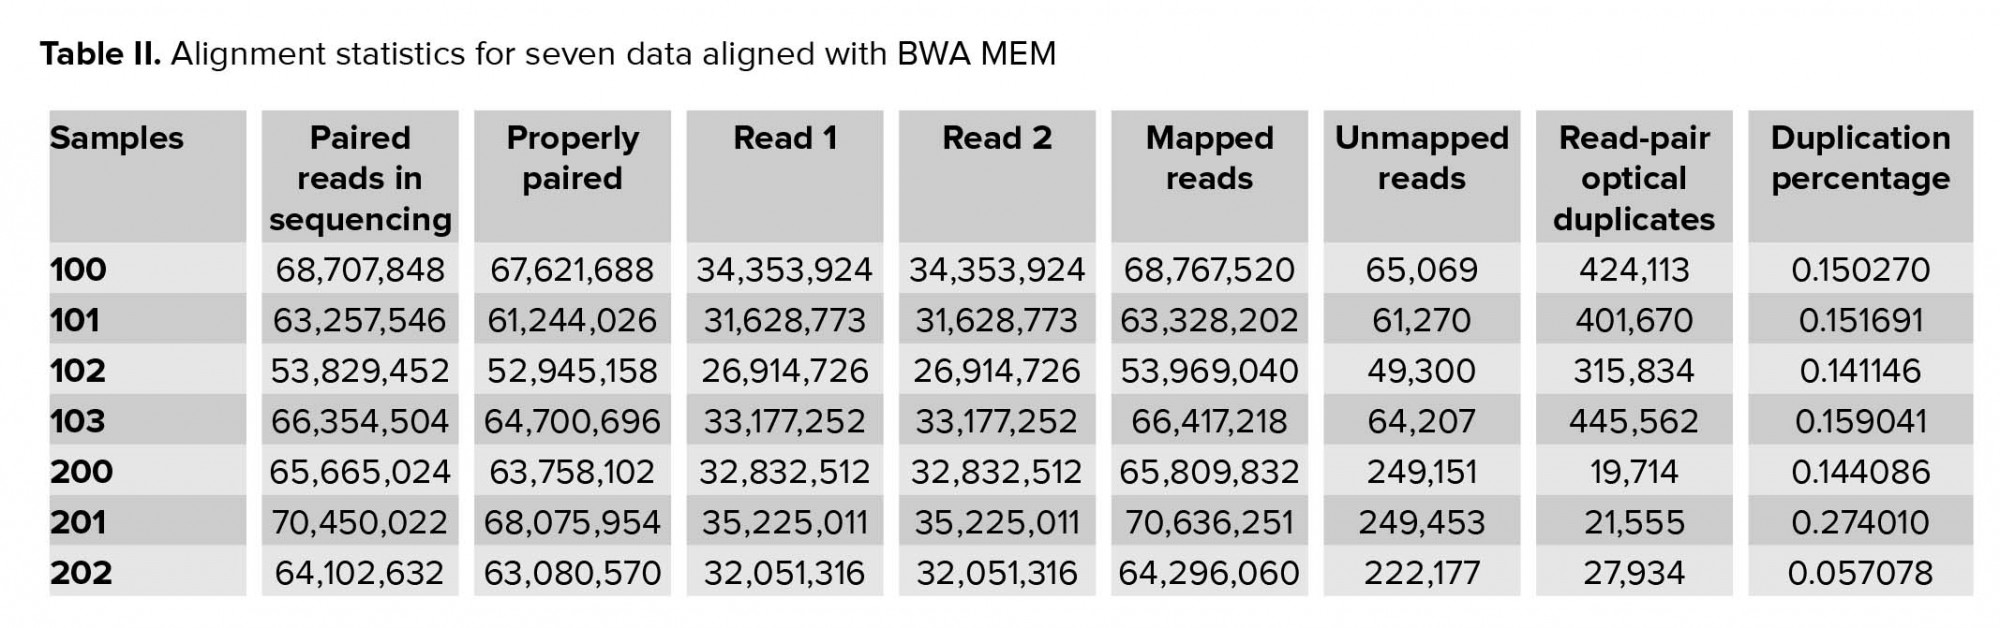
Approximately 2.5 gigabytes of exome sequence were obtained for each of the seven samples. All sequence sets yielded a comparable total number of bases, reads, GC (%), Q20 (%), and Q30 (%). Table I shows the raw stats data of each sample. FastQC was performed to check the quality of the raw data, focusing on base quality score, GC content, N content, and sequence duplication level. Mapped results, previously generated by BWA, were computed to create the number of total reads, paired reads, properly-paired reads, duplicate reads, duplication rate percentage (number of duplicates/total reads), number of reads mapped/aligned, and unique reads mapped (Table II).
3.2. Variant detection
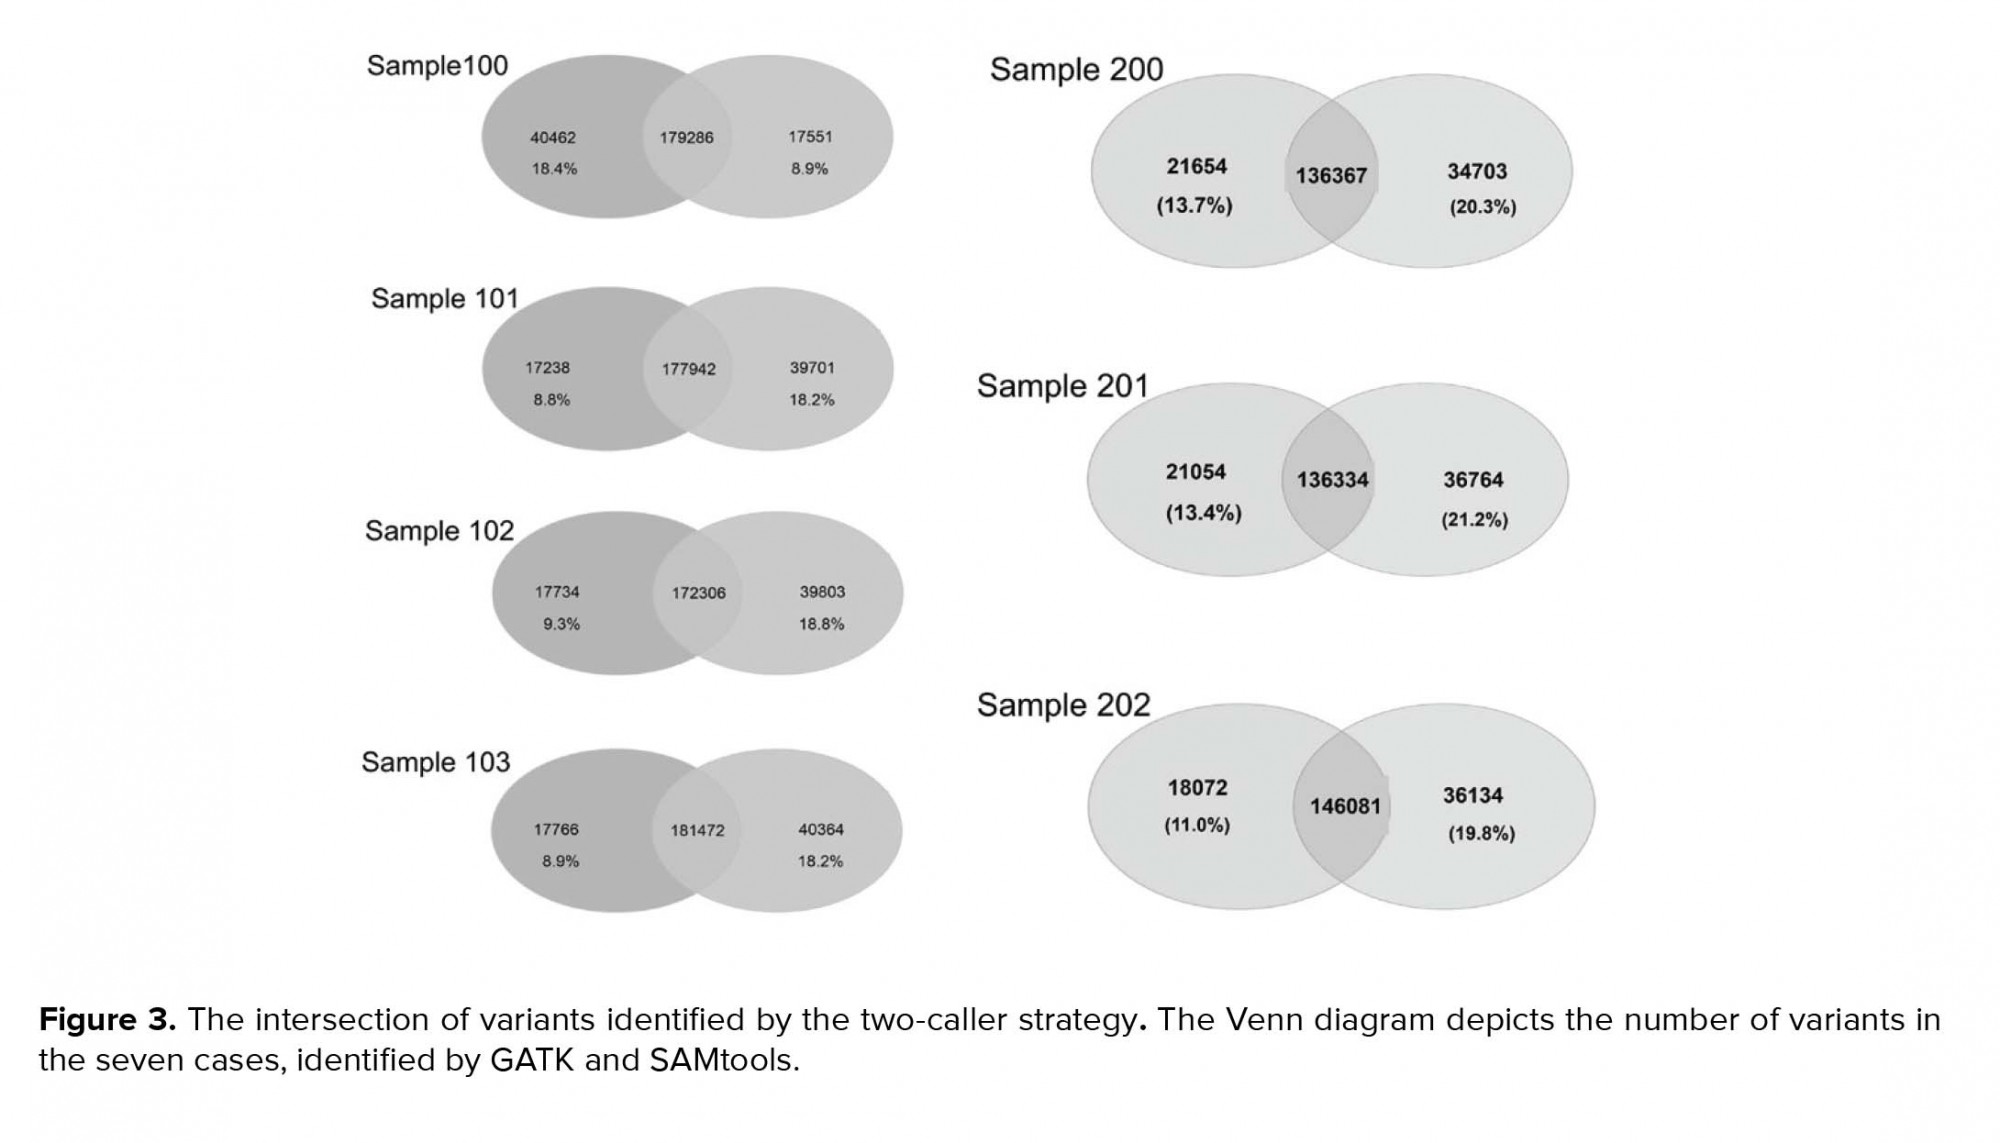
Variants were called using two different tools, GATK (version 2.6) and SAMtools (version 0.1.18), which are the most widely used, and the Unified Genotyper algorithm was applied. SSCS and MSCS were separately performed for family I and family II. The number of SNPs and Indels was determined by different callers, and we evaluated the effects of SSCS and MSCS on the variant for each family (Table III). Through SAMtool, SSCS increased the number of raw SNPs by 1.6% and 1.1% in family I and family II, respectively. In contrast, MSCS increased the number of raw SNPs called by 1.2% with GATK in both pedigrees. Variants were filtered based on the depth of coverage and quality. In SSCS and MSCS, variant filtering removed 15% and 21% of raw variants called by SAMtools, respectively, whereas 16% and 9.2% of those called by GATK were filtered. These results reflect the importance of filtering in MSCS by SAMtools. We estimated the Ts/Tv ratio of SNP sets using two SSCS and MSCS pipelines. As shown in Figure 2a, in SSCS with SAMtools, the raw SNP sets had a Ts/Tv ratio of between 1.72 and 1.88, while the Ts/Tv ratio increased in the filtered data sets. The Ts/Tv ratio was constant in both unfiltered and filtered MSCS data sets with SAMtools. The Ts/Tv ratio of the raw SNP sets was 1.34-2.07 when the GATK was used, and increased in both SSCS and MSCS with GATK (Figure 2b). The results demonstrate that 83%-91% of SNVs are called by both GATK and SAMtools (Figure 3).
3.3. Variant filtering
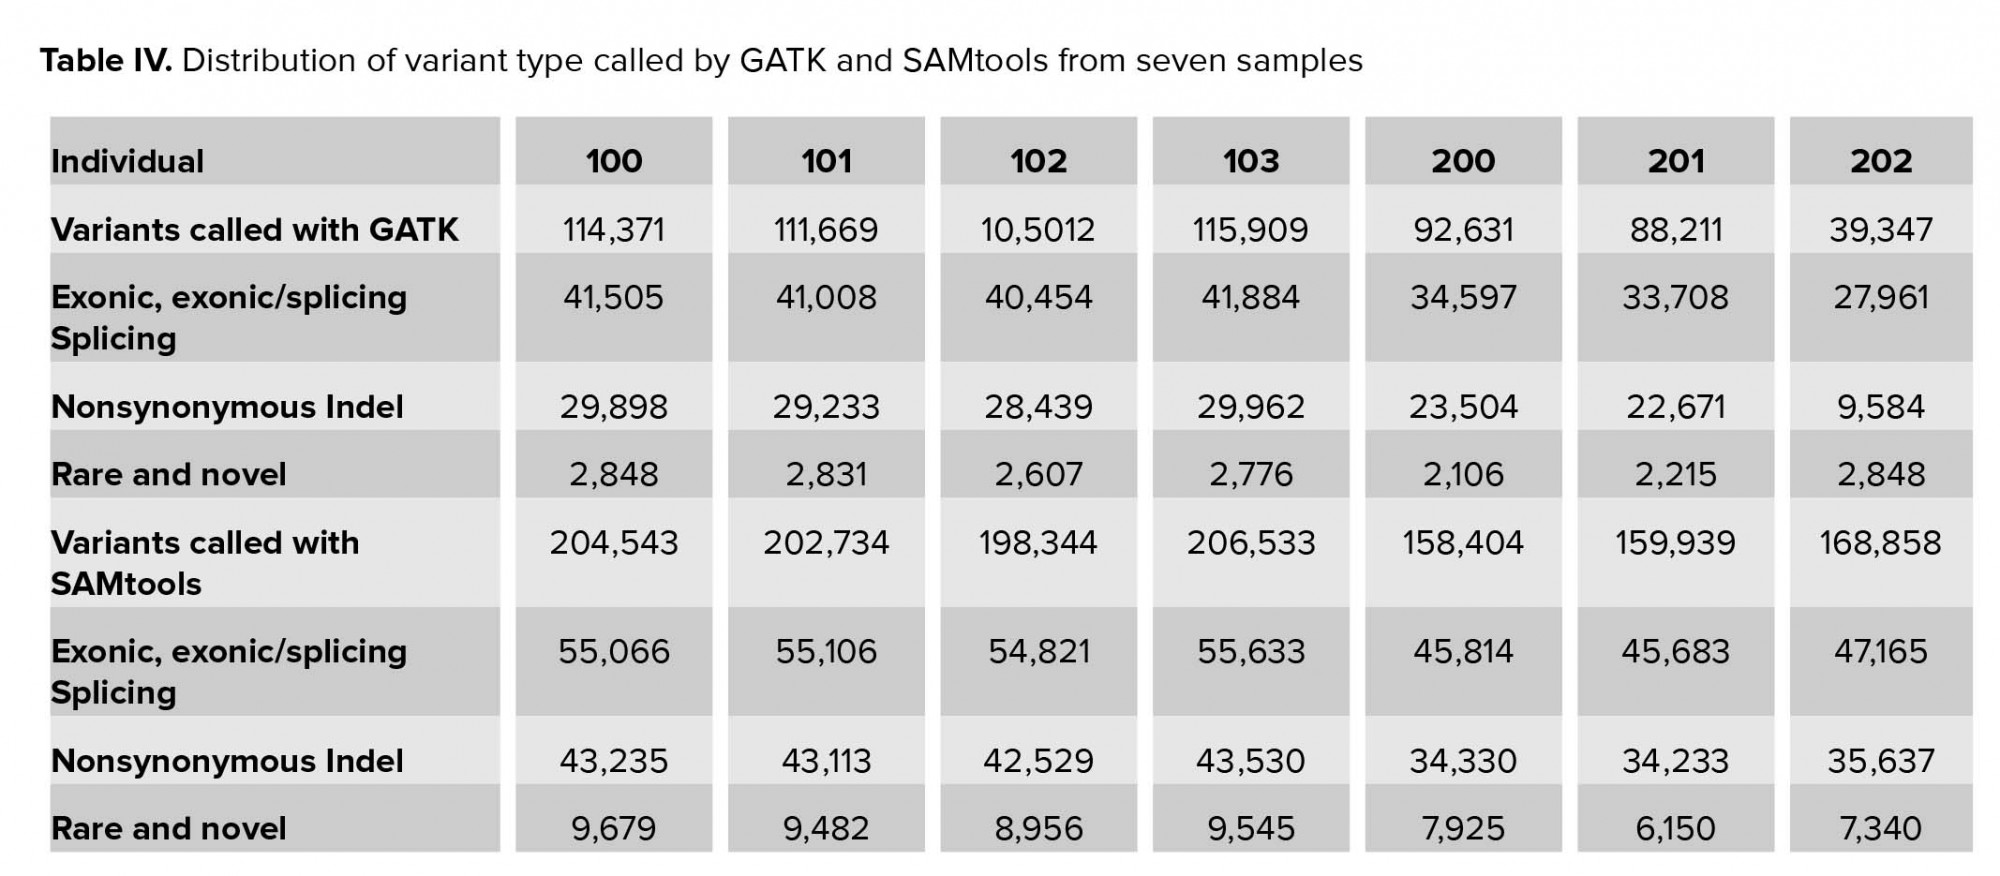
In this stage, the called variants were filtered in four stages. In the first stage, we excluded approximately two-thirds of variants, which were located in the intronic and intergenic regions. Less than 50% of variants were likely to be pathogenic. Of these, new and rare variants with MAF <1% required further analysis (Table IV). As the affected cases in family II were from a consanguineous marriage, we focused on homozygote variants. The number of private variants in pedigree II is shown in Table V. Approximately 0.05% (SAMtools) and 0.03% (GATK) of the called variations remained after initial filtering in family I (Table VI).


3. Discussion
NGS-based technology is a powerful tool for identifying the genetic basis of the human phenotype. As one of the leading molecular techniques in the field of reproductive medicine, WES has a major impact on our understanding of the genetic causes of male infertility. WES generates a large amount of genetic data; however, the processing of WES data can be complex (11). As a standard pipeline, BWA aligns the sequencing reads against the reference genome and variant callers detect the SNVs and Indels (7). In this study, SAMtools and GATK were used as variant callers with SSCS and MSCS. Both unfiltered and filtered variants indicated that SAMtools called more SNVs than GATK did owing to its lower internal filtering criteria. Our results demonstrated that filtered and called Indel variants with SAMtools decreased compared with GATK. In parallel, other studies confirmed the high potential of GATK in the identification of true Indel variants (21). In addition, the number of called raw SNVs increased in SSCS with SAMtools and in MSCS with GATK, in both families. The results showed that SAMtools and GATK are capable of calling more raw SNVs in SSCS and MSCS, respectively, in both analyzed pedigrees. Therefore, we suggest that GATK and SAMtools are appropriate callers in MSCS and SSCS, respectively. These results, along with other reports that illustrate the role of GATK in MSCS, such as those by Liu et al., demonstrate that many variants have been lost by SAMtools in MSCS (21). Cornish and Guda compared 30 different pipelines and found that Novoalign plus the GATK Unified Genotyper showed the highest sensitivity with a low number of false positives (22).
Variants were annotated by ANNOVAR, and variants outside the coding regions, as well as those of synonymous coding, were filtered out. Subsequently, known variants with a frequency greater than 1% in ExAC, dbSNP, and 1,000 Genomes were excluded, to reduce the number of potential disease-causing variants (23-25). Homozygosity mapping and linkage approaches prioritized private variants for further analysis based on the two family-based filtering strategies. As shown in Tables V and VI, SAMtools called more private variants that were either missed by GATK or flagged as low-quality.
We have shown that WES is a powerful, efficient, and cost-effective technique that significantly reduces the number of candidate genes in a small number of infertility cases in families with multiple affected individuals. Our research demonstrates that sequencing a small number of samples, while using appropriate filters against public SNVs and in-house databases, is a sufficient approach to detecting private variants. The genomic study of familial male infertility is limited in several respects: the first challenge is the identification of families that contain more than two infertile men who are willing to participate in the study. The selection of appropriate samples for sequencing is also very important. There is a level of uncertainty when detecting genuine fertile men as a result of assisted reproductive technologies, age of incidence, and cultural barriers. Therefore, great care should be taken in the selection of fertile samples.
4. Conclusion
This study demonstrates two strategies for the WES analysis of familial male infertility cases to suggest a convenient approach to identify potentially functional variants. This, in turn, may further our understanding of the underlying mechanisms behind male infertility.
Acknowledgments
The present study was supported in part by a grant from the University of Sistan and Bluchestan (USB), Zahedan, Iran, a grant from the Royan Research Institute, Tehran, Iran, and a grant from the Iran National Science Foundation (INSF).
Conflict of Interest
The authors declare that they have no conflicts of interest.
Full-Text: (414 Views)
- Introduction
Approximately 30%-40% infertility cases in men with unknown etiology may be associated with genetic factors (6). The high proportion of idiopathic infertility in males is attributed to the limitations of traditional gene identification techniques, such as the Sanger sequencing. The most notable disadvantages of these approaches include length of time, low throughput data, and a broad region for candidate genes. Most of these limitations have been addressed by next-generation sequencing (NGS) (7).
The NGS approach, or whole-exome sequencing (WES), is a powerful and unbiased tool for identifying genetic variation by capturing genome coding regions (8). WES covers a region of approximately 1%-1.5% of the human genome, where approximately 85% of causative mutations are located. Overlap-, de novo-, extreme phenotypes-, and familial-based are the four main strategies for WES analysis. Of these, family-based WES is an efficient method of identifying potential causal variants (9). This approach led to the identification of causal variants that traditional methods had failed to detect in several pedigrees (10). The WES specialist can generate large amounts of data and, consequently, be of benefit to clinics. However, excluding the called variations across the whole-exome remains an issue, and it is not reasonable to verify all types of candidates via the Sanger sequencing (11, 12). Indeed, prioritizing the best candidate pathogenic variants is the main challenge. Many previous studies have focused on the family-based strategy to increase the efficiency of discovering candidate genes and reducing the number of private variants (13).
The purpose of this study was to illustrate the basic familial framework for the purpose of identifying genes that relate to male infertility. To this end, we studied seven cases in two families. In family I, we sequenced two affected members and their parents to filter out inherited variants. In family II, we focused on the most distantly related family members to reduce shared benign variations. The advantage of this approach, by sequencing non-affected siblings, is that not many private variations were missed.
2. Case presentation
2.1 Human subjects and DNA samples
In this case series study, we examined seven cases from two unrelated families (Figure 1). DNA was extracted from the peripheral blood leukocyte using salting out methods.. The quality of the DNA was checked using an agarose gel and NanoDrop analysis.
- 2. Whole-exome sequencing platform
- 3. Quality evaluation of the raw data
- 4. Alignment and duplicated PCR removed
- 5. Variant calling and annotation
- 6. Variant filtering
- 7. Variant analysis
2.8. Ethical consideration
As a first step, written informed consent for genetic studies was obtained from subjects. This case series study was conducted in accordance with the protocols approved by the Institutional Review Board of the Royan Institute Research Center and the Royan Ethics Committee, Tehran, Iran.
2.9. Bioinformatics tools
- FastQC tool
- Trimomatic
- Burrows-Wheeler Aligner
- SAMtools
- BamTools
- Picard tool
- CalculateHsMetrics package
- GATK
- ANNOVAR
3.1. WES Run Statistics and alignment results
Approximately 2.5 gigabytes of exome sequence were obtained for each of the seven samples. All sequence sets yielded a comparable total number of bases, reads, GC (%), Q20 (%), and Q30 (%). Table I shows the raw stats data of each sample. FastQC was performed to check the quality of the raw data, focusing on base quality score, GC content, N content, and sequence duplication level. Mapped results, previously generated by BWA, were computed to create the number of total reads, paired reads, properly-paired reads, duplicate reads, duplication rate percentage (number of duplicates/total reads), number of reads mapped/aligned, and unique reads mapped (Table II).
3.2. Variant detection
Variants were called using two different tools, GATK (version 2.6) and SAMtools (version 0.1.18), which are the most widely used, and the Unified Genotyper algorithm was applied. SSCS and MSCS were separately performed for family I and family II. The number of SNPs and Indels was determined by different callers, and we evaluated the effects of SSCS and MSCS on the variant for each family (Table III). Through SAMtool, SSCS increased the number of raw SNPs by 1.6% and 1.1% in family I and family II, respectively. In contrast, MSCS increased the number of raw SNPs called by 1.2% with GATK in both pedigrees. Variants were filtered based on the depth of coverage and quality. In SSCS and MSCS, variant filtering removed 15% and 21% of raw variants called by SAMtools, respectively, whereas 16% and 9.2% of those called by GATK were filtered. These results reflect the importance of filtering in MSCS by SAMtools. We estimated the Ts/Tv ratio of SNP sets using two SSCS and MSCS pipelines. As shown in Figure 2a, in SSCS with SAMtools, the raw SNP sets had a Ts/Tv ratio of between 1.72 and 1.88, while the Ts/Tv ratio increased in the filtered data sets. The Ts/Tv ratio was constant in both unfiltered and filtered MSCS data sets with SAMtools. The Ts/Tv ratio of the raw SNP sets was 1.34-2.07 when the GATK was used, and increased in both SSCS and MSCS with GATK (Figure 2b). The results demonstrate that 83%-91% of SNVs are called by both GATK and SAMtools (Figure 3).
3.3. Variant filtering
In this stage, the called variants were filtered in four stages. In the first stage, we excluded approximately two-thirds of variants, which were located in the intronic and intergenic regions. Less than 50% of variants were likely to be pathogenic. Of these, new and rare variants with MAF <1% required further analysis (Table IV). As the affected cases in family II were from a consanguineous marriage, we focused on homozygote variants. The number of private variants in pedigree II is shown in Table V. Approximately 0.05% (SAMtools) and 0.03% (GATK) of the called variations remained after initial filtering in family I (Table VI).
3. Discussion
NGS-based technology is a powerful tool for identifying the genetic basis of the human phenotype. As one of the leading molecular techniques in the field of reproductive medicine, WES has a major impact on our understanding of the genetic causes of male infertility. WES generates a large amount of genetic data; however, the processing of WES data can be complex (11). As a standard pipeline, BWA aligns the sequencing reads against the reference genome and variant callers detect the SNVs and Indels (7). In this study, SAMtools and GATK were used as variant callers with SSCS and MSCS. Both unfiltered and filtered variants indicated that SAMtools called more SNVs than GATK did owing to its lower internal filtering criteria. Our results demonstrated that filtered and called Indel variants with SAMtools decreased compared with GATK. In parallel, other studies confirmed the high potential of GATK in the identification of true Indel variants (21). In addition, the number of called raw SNVs increased in SSCS with SAMtools and in MSCS with GATK, in both families. The results showed that SAMtools and GATK are capable of calling more raw SNVs in SSCS and MSCS, respectively, in both analyzed pedigrees. Therefore, we suggest that GATK and SAMtools are appropriate callers in MSCS and SSCS, respectively. These results, along with other reports that illustrate the role of GATK in MSCS, such as those by Liu et al., demonstrate that many variants have been lost by SAMtools in MSCS (21). Cornish and Guda compared 30 different pipelines and found that Novoalign plus the GATK Unified Genotyper showed the highest sensitivity with a low number of false positives (22).
Variants were annotated by ANNOVAR, and variants outside the coding regions, as well as those of synonymous coding, were filtered out. Subsequently, known variants with a frequency greater than 1% in ExAC, dbSNP, and 1,000 Genomes were excluded, to reduce the number of potential disease-causing variants (23-25). Homozygosity mapping and linkage approaches prioritized private variants for further analysis based on the two family-based filtering strategies. As shown in Tables V and VI, SAMtools called more private variants that were either missed by GATK or flagged as low-quality.
We have shown that WES is a powerful, efficient, and cost-effective technique that significantly reduces the number of candidate genes in a small number of infertility cases in families with multiple affected individuals. Our research demonstrates that sequencing a small number of samples, while using appropriate filters against public SNVs and in-house databases, is a sufficient approach to detecting private variants. The genomic study of familial male infertility is limited in several respects: the first challenge is the identification of families that contain more than two infertile men who are willing to participate in the study. The selection of appropriate samples for sequencing is also very important. There is a level of uncertainty when detecting genuine fertile men as a result of assisted reproductive technologies, age of incidence, and cultural barriers. Therefore, great care should be taken in the selection of fertile samples.
4. Conclusion
This study demonstrates two strategies for the WES analysis of familial male infertility cases to suggest a convenient approach to identify potentially functional variants. This, in turn, may further our understanding of the underlying mechanisms behind male infertility.
Acknowledgments
The present study was supported in part by a grant from the University of Sistan and Bluchestan (USB), Zahedan, Iran, a grant from the Royan Research Institute, Tehran, Iran, and a grant from the Iran National Science Foundation (INSF).
Conflict of Interest
The authors declare that they have no conflicts of interest.
Type of Study: Original Article |
Subject:
Reproductive Genetics
References
1. Jungwirth A, Diemer T, Dohle GR, Giwercman A, Kopa Z, Krausz C, et al. Guidelines on male infertility. Eur Urol 2015; 62: 324-332. [DOI:10.1016/j.eururo.2012.04.048] [PMID]
2. Shi X, Chan CPS, Waters T, Chi L, Chan DYL, Li TC. Lifestyle and demographic factors associated with human semen quality and sperm function. Syst Biol Reprod Med 2018; 64: 358-367. [DOI:10.1080/19396368.2018.1491074] [PMID]
3. O'Flynn O'Brien KL, Varghese AC, Agarwal A. The genetic causes of male factor infertility: A review. Fertil Steril 2010; 93: 1-12. [DOI:10.1016/j.fertnstert.2009.10.045] [PMID]
4. Theisen A, Shaffer LG. Disorders caused by chromosome abnormalities. Appl Clin Genet 2010; 3: 159-174. [DOI:10.2147/TACG.S8884] [PMID] [PMCID]
5. Hamada AJ, Esteves SC, Agarwal A. A comprehensive review of genetics and genetic testing in azoospermia. Clinics 2013; 68 (Suppl.): 39-60. [DOI:10.6061/clinics/2013(Sup01)06]
6. Agarwal A, Mulgund A, Hamada A, Chyatte MR. A unique view on male infertility around the globe. Reprod Biol Endocrinol 2015; 13: 37-45. [DOI:10.1186/s12958-015-0032-1] [PMID] [PMCID]
7. Gilissen C, Hoischen A, Brunner HG, Veltman JA. Disease gene identification strategies for exome sequencing. Eur J Hum Genet 2012; 20: 490-497. [DOI:10.1038/ejhg.2011.258] [PMID] [PMCID]
8. Ramasamy R, Bakircioʇlu ME, Cengiz C, Karaca E, Scovell J, Jhangiani SN, et al. Whole-exome sequencing identifies novel homozygous mutation in NPAS2 in family with nonobstructive azoospermia. Fertil Steril 2015; 104: 286-291. [DOI:10.1016/j.fertnstert.2015.04.001] [PMID] [PMCID]
9. Shirzad H, Beiraghi N, Ataei Kachoui M, Akbari MT. Family-Based Whole-Exome Sequencing for Identifying Novel Variants in Consanguineous Families with Schizophrenia. Iran Red Crescent Med J 2016; 19: 1-8. [DOI:10.5812/ircmj.35788]
10. Askari M, Karamzadeh R, Karimi-jafari MH, Mohseni A, Mehdi M, Bashamboo A, et al. Identification of a missense variant in CLDN2 in obstructive azoospermia. J Hum Genet 2019; 64: 1023-1032. [DOI:10.1038/s10038-019-0642-0] [PMID]
11. Bamshad MJ, Ng SB, Bigham AW, Tabor HK, Emond MJ, Nickerson DA, et al. Exome sequencing as a tool for Mendelian disease gene discovery. Nat Rev Genet 2011; 12: 745-755. [DOI:10.1038/nrg3031] [PMID]
12. McClellan J, King MC. Genetic heterogeneity in human disease. Cell 2010; 141: 210-217. [DOI:10.1016/j.cell.2010.03.032] [PMID]
13. Askari M, Kordi-tamandani DM, Almadani N, Mcelreavey K. Identification of a homozygous GFPT2 variant in a family with asthenozoospermia. Gene 2019; 699: 16-23. [DOI:10.1016/j.gene.2019.02.060] [PMID]
14. The Genome Sequencing Consortium. Initial sequencing and analysis of the human genome. Nature. 2001; 409: 860-921. [DOI:10.1038/35057062] [PMID]
15. Li H, Durbin R. Fast and accurate short read alignment with Burrows-Wheeler transform. Bioinformatics 2009; 25: 1754-1760. [DOI:10.1093/bioinformatics/btp324] [PMID] [PMCID]
16. DePristo MA, Banks E, Poplin R, Garimella KV, Maguire JR, Hartl C, et al. A framework for variation discovery and genotyping using next- generation DNA sequencing data. Nat Genet 2011; 43: 491-498. [DOI:10.1038/ng.806] [PMID] [PMCID]
17. Wang K, Li M, Hakonarson H. ANNOVAR: Functional annotation of genetic variants from high-throughput sequencing data. Nucleic Acids Res 2010; 38: e164-e170. [DOI:10.1093/nar/gkq603] [PMID] [PMCID]
18. Venselaar H, Te Beek TA, Kuipers RK, Hekkelman ML, Vriend G. Protein structure analysis of mutations causing inheritable diseases. An e-Science approach with life scientist friendly interfaces. BMC Bioinformatics 2010; 11: 548. [DOI:10.1186/1471-2105-11-548] [PMID] [PMCID]
19. Desmet FO, Hamroun D, Lalande M, Collod-Bëroud G, Claustres M, Béroud C. Human Splicing Finder: An online bioinformatics tool to predict splicing signals. Nucleic Acids Res 2009; 37: e67-e80. [DOI:10.1093/nar/gkp215] [PMID] [PMCID]
20. Cartegni L, Wang J, Zhu Z, Zhang MQ, Krainer AR. ESEfinder: A web resource to identify exonic splicing enhancers. Nucleic Acids Res 2003; 31: 3568-3571. [DOI:10.1093/nar/gkg616] [PMID] [PMCID]
21. Liu ZK, Shang YK, Chen ZN, Bian H. A three-caller pipeline for variant analysis of cancer whole-exome sequencing data. Mol Med Rep 2017; 15: 2489-2494. [DOI:10.3892/mmr.2017.6336] [PMID] [PMCID]
22. Cornish A, Guda C. A Comparison of Variant Calling Pipelines Using Genome in a Bottle as a Reference. Biomed Res Int 2015; 2015: 456479. [DOI:10.1155/2015/456479] [PMID] [PMCID]
23. 1000 Genomes Project Consortium, Auton A, Brooks LD, Durbin RM, Garrison EP, Kang HM, et al. A global reference for human genetic variation. Nature 2015; 526: 68-74. [DOI:10.1038/nature15393] [PMID] [PMCID]
24. Sherry ST, Ward MH, Kholodov M, Baker J, Phan L, Smigielski EM, et al. dbSNP. the NCBI database of genetic variation. Nucleic Acids Res 2001; 29: 308-311. [DOI:10.1093/nar/29.1.308] [PMID] [PMCID]
25. Lek M, Karczewski KJ, Minikel EV, Samocha KE, Banks E, Fennell T, et al. Analysis of protein-coding genetic variation in 60,706 humans. Nature 2016; 536: 285-291. [DOI:10.1038/nature19057] [PMID] [PMCID]
Send email to the article author
| Rights and permissions | |
 |
This work is licensed under a Creative Commons Attribution-NonCommercial 4.0 International License. |