
International Journal of
Reproductive Biomedicine
Sat, Jul 5, 2025
[Archive]
Volume 19, Issue 11 (November 2021)
IJRM 2021, 19(11): 959-968 |
Back to browse issues page


![]()
![]()
![]()
Download citation:
BibTeX | RIS | EndNote | Medlars | ProCite | Reference Manager | RefWorks
Send citation to:


BibTeX | RIS | EndNote | Medlars | ProCite | Reference Manager | RefWorks
Send citation to:
Manoochehri Z, Manoochehri S, Soltani F, Tapak L, Sadeghifar M. Predicting preeclampsia and related risk factors using data mining approaches: A cross-sectional study. IJRM 2021; 19 (11) :959-968
URL: http://ijrm.ir/article-1-1989-en.html
URL: http://ijrm.ir/article-1-1989-en.html


1- Department of Biostatistics, Student Research Committee, Hamadan University of Medical Sciences, Hamadan, Iran.
2- Department of Midwifery, School of Nursing and Midwifery, Hamadan University of Medical Sciences, Hamadan, Iran.
3- Modeling of Noncommunicable Disease Research Center, Department of Biostatistics, School of Public Health, Hamadan University of Medical Sciences, Hamadan, Iran.
4- Department of Statistics, Faculty of Basic Sciences, Bu-Ali Sina University, Hamadan, Iran. ,sadeghifar@basu.ac.ir
2- Department of Midwifery, School of Nursing and Midwifery, Hamadan University of Medical Sciences, Hamadan, Iran.
3- Modeling of Noncommunicable Disease Research Center, Department of Biostatistics, School of Public Health, Hamadan University of Medical Sciences, Hamadan, Iran.
4- Department of Statistics, Faculty of Basic Sciences, Bu-Ali Sina University, Hamadan, Iran. ,
Keywords: Preeclampsia, Random forest, C5.0 decision tree, Support vector machine, Logistic regression.
Full-Text [PDF 473 kb]
(1210 Downloads)
| Abstract (HTML) (2165 Views)
1. Introduction
Pregnancy blood pressure disorders are one of the most common adverse pregnancy outcomes worldwide (1). One of the most important types of these disorders is preeclampsia (2). Preeclampsia, which usually begins after the 20th wk of pregnancy, is defined as blood pressure of at least 140/90 mm Hg in two separate stages at least four hr apart, along with proteinuria of at least 0.3 g in the urine collected within 24 hr (3). This syndrome, which affects 5-8% of pregnancies worldwide, is one of the leading causes of maternal and fetal mortality (4-6).
The prevalence of preeclampsia varies in different parts of Iran with reports of 4% in rural areas and 10% in urban areas (7). Preeclampsia can lead to complications such as renal necrosis, pulmonary edema, liver rupture, hemolysis, increased liver enzymes, decreased platelet syndrome, and stroke (8). In addition to the above, preeclampsia is associated with intrauterine fetal growth restriction, bleeding problems, preterm delivery, and low birth weight (9). In addition to threatening the mother's physical health, this disorder can lead to emotional disorders such as anxiety and depression (8). Unfortunately, no simple test is available to diagnose preeclampsia, and diagnosis is performed only by repeated visits during pregnancy, repeated blood pressure measurements, and urine analysis, which are costly and highly sensitive, and delay diagnosing the disorder (3). Therefore, simple alternative diagnostic methods are needed.
One of these prediction methods is classification. The simplest type of classification method divides subjects into two groups such as healthy and sick. Classification is one of the main tasks in the field of data mining. Data mining, which is the science of exploring knowledge from data, identifies potential trends, invisible communications, and hidden patterns between the mass of datasets (10). Data mining methods are known as a useful tool for diagnosing a variety of diseases or predicting clinical consequences. In most studies, these techniques are more accurate than conventional methods of predicting disease (11, 12). So far, various classification methods have been introduced to the field of data mining, the most common of which are logistic regression (LR), k-nearest neighborhood (k-NN), C5.0 decision tree, random forest (RF), support vector machine (SVM) and linear discriminant analysis (LDA) (13, 14).
LR, C5.0 decision tree and RF, in addition to predicting disease status, can identify the risk factors related to a disease. Therefore, in this study, we aimed to select the model with the best performance among the six data mining approaches mentioned above, and to use it as a screening tool to identify mothers with preeclampsia. We also used LR, C5.0 decision tree and RF to identify the risk factors associated with this syndrome. It should be noted that in employing these models, we used clinical data recorded in the hospital which did not require large expenses.
2. Materials and Methods
2.1. Study design and participants
In this cross-sectional study, information about 1452 pregnant women who were referred to Fatemieh Hospital, in Hamadan City, in western Iran that underwent prenatal care during April 2005- March 2015 was used. As the inclusion criteria, all women should complain about hypertension problems (blood pressure of at least 140/90 mm Hg). Mothers with fetal death or multiple pregnancy (e.g. twins) were excluded from the study. Information about each mother was obtained from their clinical files. This information was extracted using a checklist that included the following variables: age, education, job, number of pregnancies, number of children, sex of the fetus, the season of pregnancy, underlying conditions including hypertension, kidney disease, heart disease and diabetes, and finally preeclampsia status (categorized as with or without preeclampsia).
2.2. Software
After collecting the information, approximately 70% of the total sample (1016 people) were used for training and about 30% of the remaining sample (435people) were used to test the models. The training data is used to build and train the model and the test data is used to assess the performance of the model to predict healthy or patient classes (in our study-with preeclampsia or without preeclampsia). Data were processed in the R 3.2.2 software environment. To build the models using the R software, the C50 package for C5.0 decision tree, e1071 package for SVM, random Forest package for RF model, and MASS package for LDA were used and their performance was compared using accuracy, sensitivity, and specificity criteria on the test data.
2.3. Ethical considerations
Details of the women were collected without including the name. In addition, individuals' information was kept confidential. The study was approved by the Vice-Chancellor for Research and Technology, Hamadan University of Medical Sciences, Hamadan, Iran (Code: 9505122624).
2.4. Statistical analysis
2.4.1. Logistic regression (LR)
LR is a standard method for binary classification. In LR, Y represents the binary response variable (in this study, Y = 1 for a subject with preeclampsia and Y = 0 for without preeclampsia) and X1, …, XP represent the vector features (in our study, clinical features of patients). In this case, the probability of Y = 1 (probability of belonging to the class of mothers with preeclampsia) was calculated as follows:

Based on this, the person would have been assigned to class 1 if P (Y = 1) > C and otherwise to class 0, where C was a fixed number (15, 16).
2.4.2. k-nearest neighborhood (k-NN)
The k-NN algorithm is a non-parametric method that is commonly used for classification and regression problems. It is one of the most widely used algorithms due to its simplicity and ease of implementation. In order to classify a new person into one of the healthy or patient classes (in our study - with preeclampsia or without preeclampsia) that displayed in the feature space with a point, k-NN calculates the distance between this point and the other points in the training dataset. Euclidean distance is usually used as the distance criterion. This distance between A and B was calculated as follows:

Then the point was assigned to a class in the k nearest neighborhood where k was an integer (17).
2.4.3. Linear discriminant analysis (LDA)
LDA is a classic classifier that uses a linear decision function for classification. In this method, a linear combination of independent variables (features) was used to separate the dependent variable classes in the best way. In other words, the goal was to find a linear function that maximized the probability of separation between the two groups. The conditional probability of independent variables given the label class was used to predict the label class of a new case. A function was used to maximize the distance between the mean of the groups so that the scatter within the classes was minimized and the scatter between classes was maximized (18).
2.4.4. Decision tree
The structure of the decision tree is similar to a tree, which includes roots, branches, and leaves. The classification tree divided the data (parent node) into two subsets (children node) using a split criterion. This division continued until we finally reached a homogeneous level of response in each node. In decision tree, the branches represent combinations of input features and the leaves represent the labels of the target class (in our study, 0 was the label of the without preeclampsia class and 1 was the label of the with preeclampsia class) (19).
The rules produced by the decision tree were explained using the logical terms "if" and "then". The decision trees that are most common are ID3, C4.5, C5.0 and CART (16). The C5.0 decision tree, which was introduced by Quinlan in 1987, is modified from the C4.5 version (20). C5.0 decision tree is faster than the C4.5 and produces more precise rules (21). Therefore, in this study, we used this type of decision tree.
2.4.5. Random forest (RF)
RF is an "ensemble learning" technique that involves a large number of decision trees whose variance is lower than that of a single decision tree. Each RF tree was based on a bootstrap sample that was randomly extracted from the original dataset and built using the CART method and the Decrease Gini Impurity split criterion (22).
2.4.6. Support vector machine (SVM)
SVM was introduced by Vapnik in 1979. Its goal is to find the best function for classification so that the members of the two classes (in our study-with preeclampsia or without preeclampsia) can be distinguished in the dataset. Assuming that the classes are linearly separable, to separate the classes, a hyperplane with a maximum margin is created (23). But in cases where the input dataset is not linearly separable, using the kernel function the data are mapped to the feature space with a high dimension so that they can be separated linearly in this new space. The most common kernel functions used in SVM are linear, polynomial, and radial basis function (RBF) kernel. In this study, we used the RBF kernel because it has more generalizability than other kernel functions (24). The equation we used for RBF kernel was as follows:

3. Results
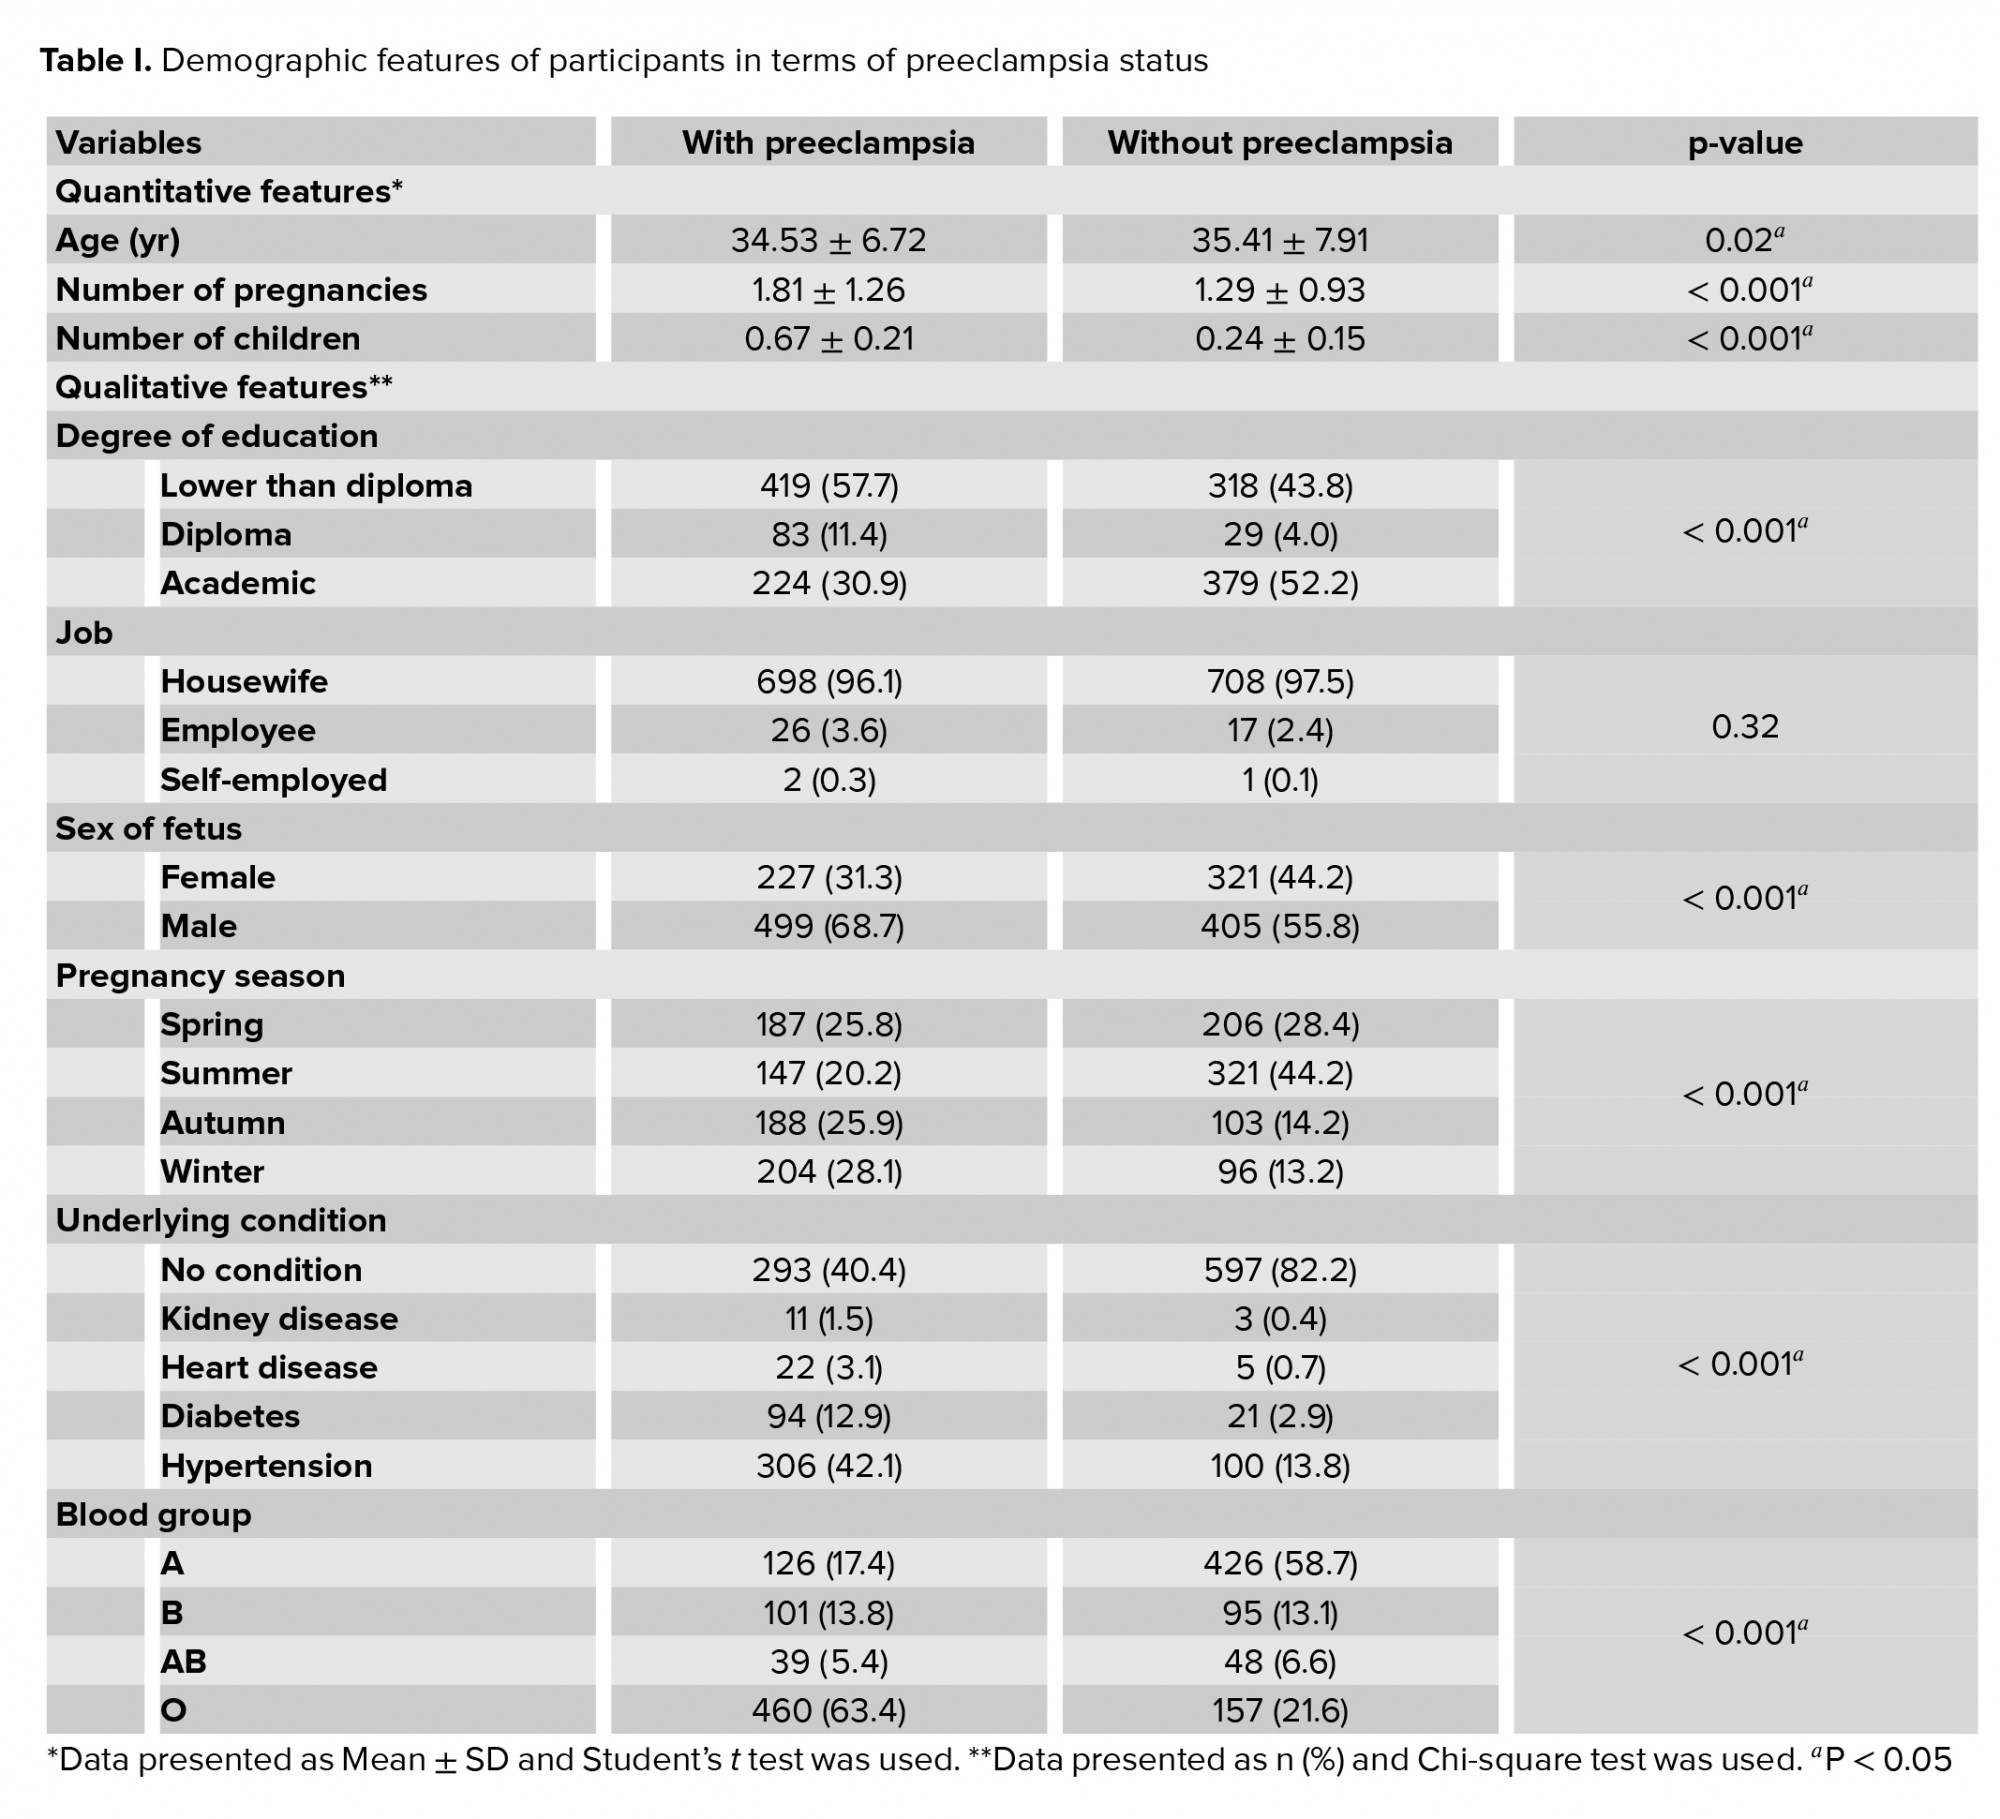
Of the 1452 pregnant women in this study that underwent prenatal care, 726 subjects were diagnosed with preeclampsia, and 726 subjects were diagnosed without this condition. The mean age for mothers with preeclampsia (35.41 ± 7.91) was higher than the mean age for mothers without preeclampsia (34.53 ± 6.72) (p = 0.02). Most mothers in the preeclampsia group had blood type O (63.4%), while in the group without preeclampsia, the most common blood type was A (58.7%). Most mothers with preeclampsia had a male fetus (68.7%), and this percentage was found to be 58.9% for mothers without the disorder; this difference was statistically significant (p < 0.001).
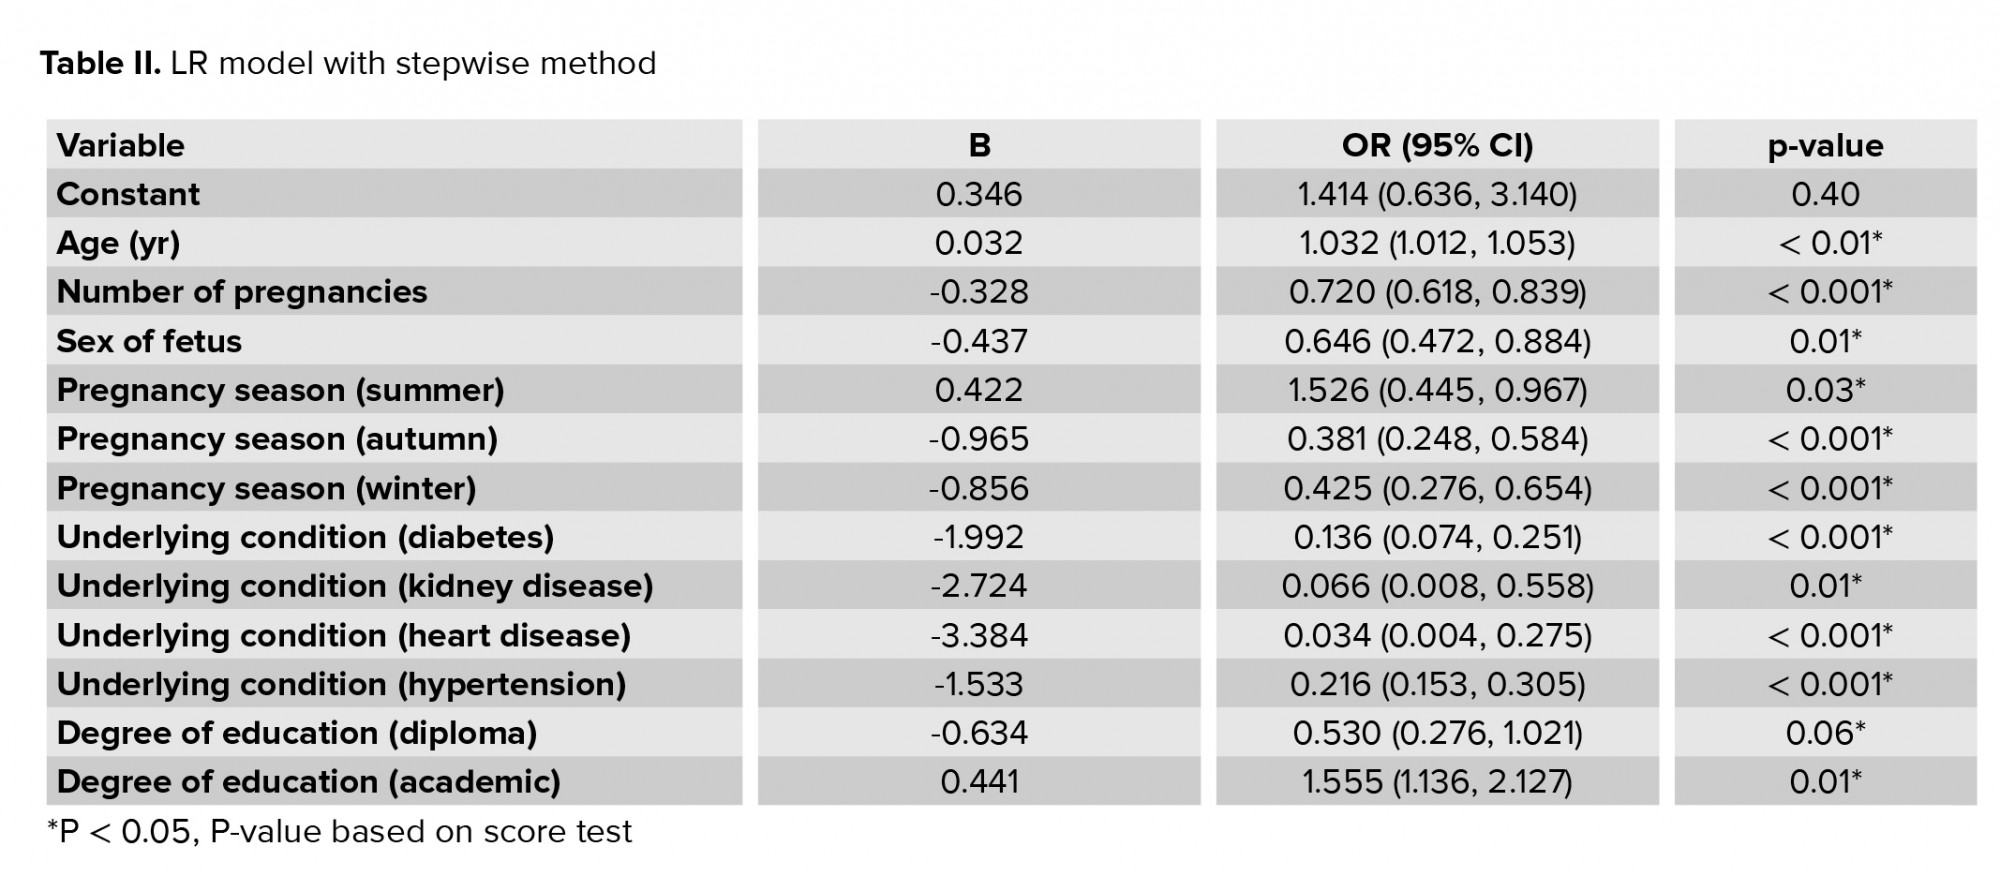
Most mothers in the preeclampsia group (42.1%) had high blood pressure, and in the control group, the majority did not have any underlying conditions (82.2%). The highest frequency of preeclampsia was observed in March and the lowest in July, and there was a significant relationship between hot and cold months and preeclampsia (p < 0.001). The results of comparing the other variables in the two groups are reported in table I. All variables were entered into the LR model using the stepwise backward elimination method and the odds ratios for each variable are given in table II.
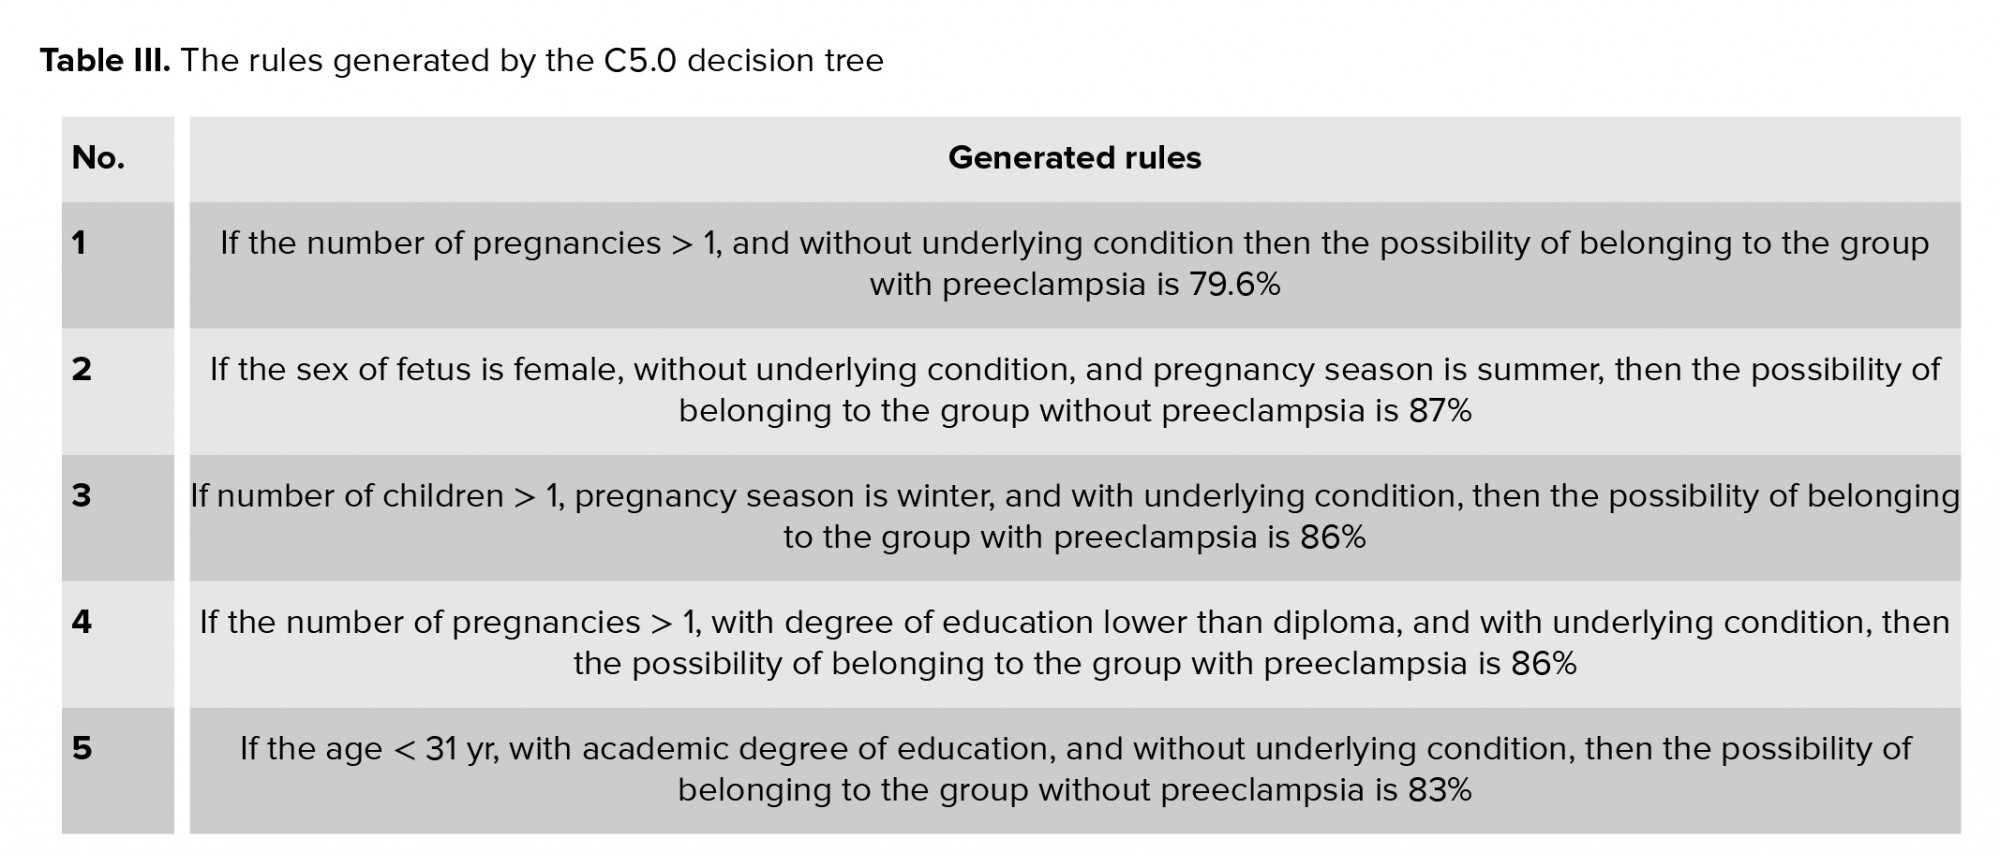
The rules derived from the C5.0 decision tree are stated in table III. Among the variables used in this study, the variables that contributed most to the extracted rules from the C5.0 decision tree were underlying conditions (100%), degree of education (21.44%), pregnancy season (44.55%) and the number of pregnancies (10.42%).
Based on the results from the RF model, the most important variable in predicting preeclampsia was the underlying conditions. Age, pregnancy season, number of pregnancies, and the number of children were other important variables in predicting preeclampsia. The order of factors that were important in predicting preeclampsia is reported in figure 1.
For the k-NN model, the highest accuracy was obtained for k = 21, and in the SVM model, the maximum accuracy for the RBF kernel function was obtained for the parameters C = 17034.19, ɣ = 0.3049167 (24).
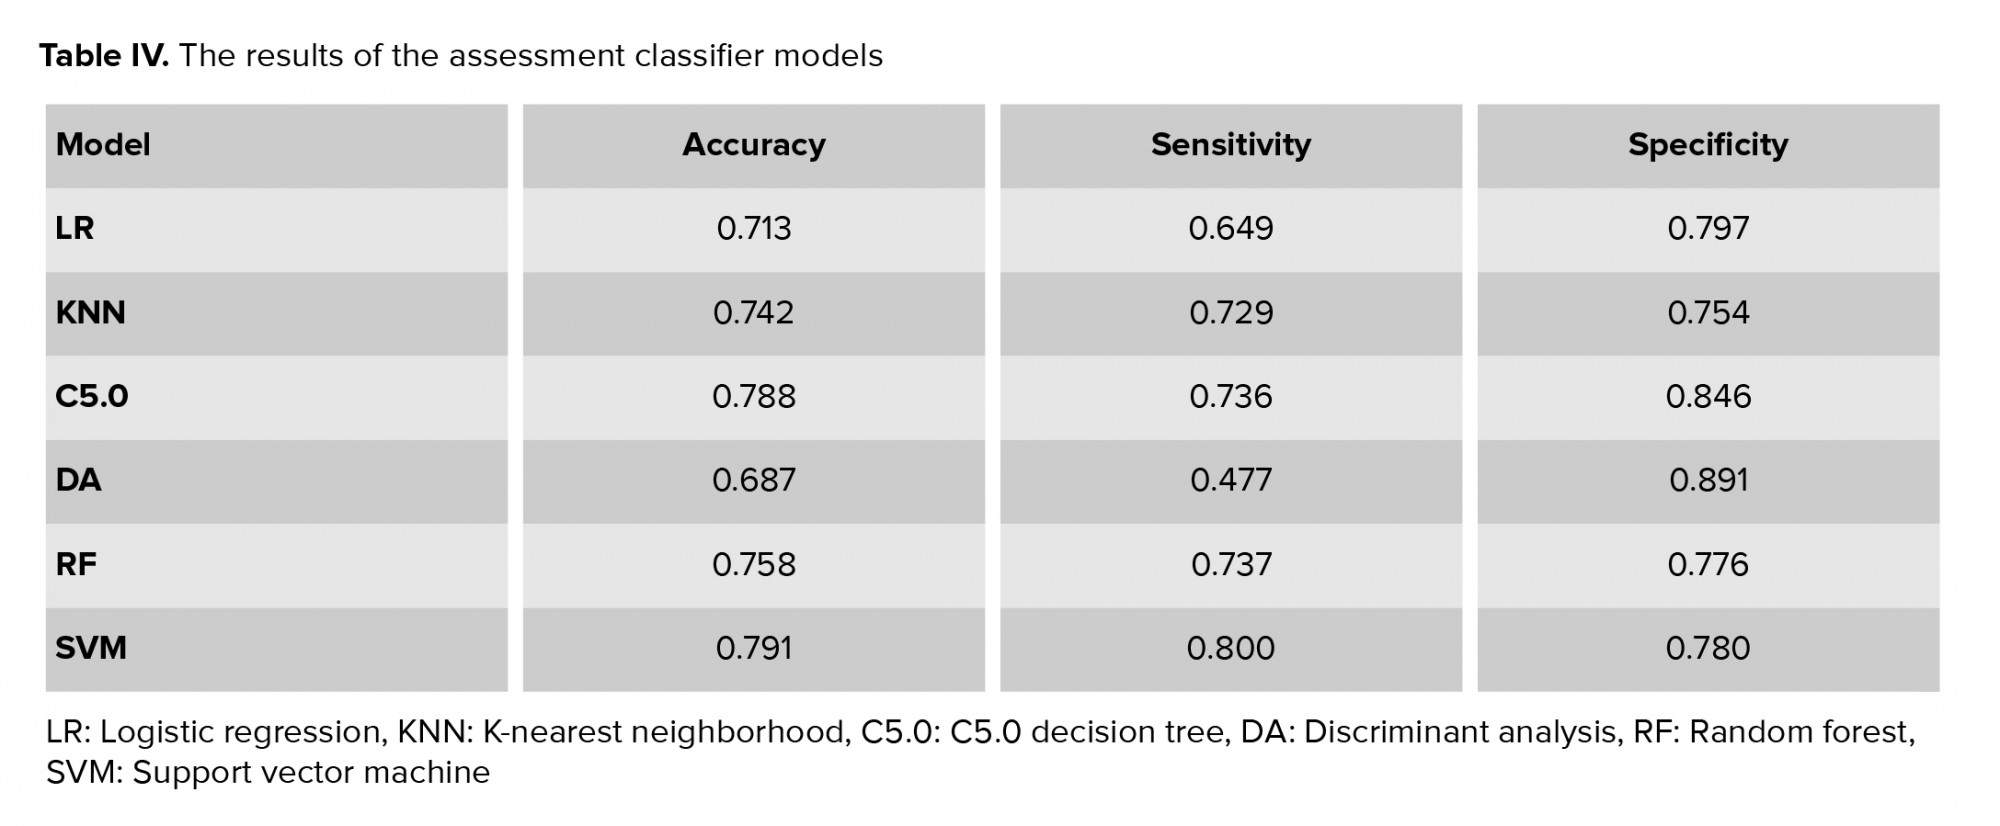
To evaluate and compare the performance of the models proposed for the classification of mothers with vs. without preeclampsia, the models were performed on test data (n = 435). The performance evaluation criteria for the models, including accuracy, sensitivity, and specificity, were calculated using the following equation and the results are shown in table IV.

True positive (TP), true negative (TN), false positive (FP), and false negative (FN) were obtained from the classifier (24).

4. Discussion
Due to the serious risks that preeclampsia poses to the mother and fetus, it is important to use methods that can predict this outcome. However, despite recent advances in the etiology of preeclampsia, to date, no clinical screening tests have been identified to diagnose the disorder (25). Identifying the underlying and predictive factors of preeclampsia can play a significant role in reducing mortality and complications in the mother and fetus. In addition to identifying the risk factors associated with preeclampsia, this study aimed to compare common data mining approaches and select the strongest model to help professionals in this field. In this section, we will first consider the most important risk factors associated with preeclampsia and then discuss the performance of the data mining models.
According to the results of the univariate analysis (Table I), most mothers in the preeclampsia group had blood type O (63.4%). However, in the group without preeclampsia, most people had blood type A (58.7%). A study by Elmugabil also showed that mothers with blood type O were more at risk for eclampsia (26). The distribution of the sex of the fetus in the two groups was also significantly different (p < 0.001) so that most mothers in the preeclampsia group had a male fetus (68.7%). Among the models adopted in the present study, LR, C5.0 decision tree, and RF models, in addition to predicting the response variable (preeclampsia status), also identified the risk factors related to the condition. Based on the results of fitting these three models, the variables of underlying condition, age, pregnancy season, and number of pregnancies were the most important risk factors in diagnosing preeclampsia. In a study by Rezende and co-authors, a significant difference was obtained between the preeclampsia and control groups in terms of variables such as gestational age, chronic hypertension, and type 1 and type 2 diabetes, which is consistent with the results of the present study (27). In a study conducted by Farzaneh and co-workers to identify risk factors for preeclampsia, a history of hypertension was one of the main risk factors, but contrary to our study, there was no association between preeclampsia and age, number of pregnancies, or gestational age (28).
Based on the results of fitting the data mining models, the accuracy with the test data was as follows: SVM (0.791), C5.0 (0.788), RF (0.758), k-NN (0.742), LR (0.0713), LDA (0.687). Therefore, according to the obtained results, SVM had the highest accuracy among the fitted models. In a study conducted by Asfaw to predict diabetes, the SVM model had the highest accuracy among the six data mining models that were used, which included SVM, decision tree, RF, Naïve Bayes, LR, and k-NN (29). But this result is inconsistent with a study conducted by Basu et al. to diagnose breast cancer where RF had the highest accuracy (92.98%) among the classification methods decision tree, SVM, k-NN, and RF; SVM was in second place with an accuracy of 61.403%, and k-NN had the lowest accuracy (30). In fact, in most data mining studies, there is close competition between the SVM and RF models so that in some studies, SVM accuracy exceeds RF (29), and in other cases, the opposite is true (30). In the present study, after SVM, C5.0 decision tree and RF also performed well. One of the advantages of C5.0 decision tree and RF was that these models, in addition to predicting with acceptable accuracy, were also able to identify risk factors affecting the condition whereas this advantage did not exist for SVM, k-NN, and LDA. Another advantage of the decision tree model was that it provided an intuitive image of the impact of risk factors by presenting a series of rules.
In our study, the LDA model had the least predictive accuracy, which is inconsistent with the results of a study conducted by Maroco and colleagues to predict dementia by comparing artificial neural network, SVM, RF, LR, and decision tree models; in this study, LDA was the most accurate model after SVM and RF (31). In our study, after LDA, the LR model had the lowest ability to diagnose patients with preeclampsia (accuracy = 0.713). This is inconsistent with the results of a study in which the LR model had the highest diagnostic power in predicting breast cancer compared to models such as Naïve Bayes, k-NN, Ada Boost, and decision tre e-J 48 (32). However, the LR model had the advantage that, by interpreting the coefficients in this model and also calculating the value of the odds ratios, the effect of each variable on the response variable (preeclampsia) could be calculated and interpreted. This advantage did not exist in the other classification methods. For example, for the degree of education variable, an odds ratio of 1.55 was obtained (Table II). This means that having an academic education compared with education less than diploma increased the chances of developing preeclampsia by 0.55.
One of the limitations of the present study was the potential recall bias, because pregnant mothers may not remember much of the information about pregnancy; this is an unavoidable error in data collection in such studies. Finally, it is recommended that these models be used on more genetic and clinical risk factors to achieve higher diagnostic power.
5. Conclusion
Among the data mining models employed in this study, the SVM model had the highest prediction accuracy. Therefore, we can conclude that this model can be used as a screening tool to help predict preeclampsia. Based on the results of the RF model, which also showed good performance in this study, the variables of underlying condition, degree of education, pregnancy season, and the number of pregnancies were the most important risk factors associated with preeclampsia. Therefore, by controlling these factors and also regularly monitoring the blood pressure of mothers with these risk factors, the potential risks associated with this syndrome can be reduced.
Acknowledgments
The study was funded by the Vice-Chancellor for Research and Technology, Hamadan University of Medical Sciences, Hamadan, Iran (No. 9505122624). This article is taken from the research project (No. 9505122624) approved by the ethics committee of Hamadan University of Medical Sciences in 2020-09-20.
Conflict of Interest
The authors declare that they have no conflict of interest.
Full-Text: (488 Views)
1. Introduction
Pregnancy blood pressure disorders are one of the most common adverse pregnancy outcomes worldwide (1). One of the most important types of these disorders is preeclampsia (2). Preeclampsia, which usually begins after the 20th wk of pregnancy, is defined as blood pressure of at least 140/90 mm Hg in two separate stages at least four hr apart, along with proteinuria of at least 0.3 g in the urine collected within 24 hr (3). This syndrome, which affects 5-8% of pregnancies worldwide, is one of the leading causes of maternal and fetal mortality (4-6).
The prevalence of preeclampsia varies in different parts of Iran with reports of 4% in rural areas and 10% in urban areas (7). Preeclampsia can lead to complications such as renal necrosis, pulmonary edema, liver rupture, hemolysis, increased liver enzymes, decreased platelet syndrome, and stroke (8). In addition to the above, preeclampsia is associated with intrauterine fetal growth restriction, bleeding problems, preterm delivery, and low birth weight (9). In addition to threatening the mother's physical health, this disorder can lead to emotional disorders such as anxiety and depression (8). Unfortunately, no simple test is available to diagnose preeclampsia, and diagnosis is performed only by repeated visits during pregnancy, repeated blood pressure measurements, and urine analysis, which are costly and highly sensitive, and delay diagnosing the disorder (3). Therefore, simple alternative diagnostic methods are needed.
One of these prediction methods is classification. The simplest type of classification method divides subjects into two groups such as healthy and sick. Classification is one of the main tasks in the field of data mining. Data mining, which is the science of exploring knowledge from data, identifies potential trends, invisible communications, and hidden patterns between the mass of datasets (10). Data mining methods are known as a useful tool for diagnosing a variety of diseases or predicting clinical consequences. In most studies, these techniques are more accurate than conventional methods of predicting disease (11, 12). So far, various classification methods have been introduced to the field of data mining, the most common of which are logistic regression (LR), k-nearest neighborhood (k-NN), C5.0 decision tree, random forest (RF), support vector machine (SVM) and linear discriminant analysis (LDA) (13, 14).
LR, C5.0 decision tree and RF, in addition to predicting disease status, can identify the risk factors related to a disease. Therefore, in this study, we aimed to select the model with the best performance among the six data mining approaches mentioned above, and to use it as a screening tool to identify mothers with preeclampsia. We also used LR, C5.0 decision tree and RF to identify the risk factors associated with this syndrome. It should be noted that in employing these models, we used clinical data recorded in the hospital which did not require large expenses.
2. Materials and Methods
2.1. Study design and participants
In this cross-sectional study, information about 1452 pregnant women who were referred to Fatemieh Hospital, in Hamadan City, in western Iran that underwent prenatal care during April 2005- March 2015 was used. As the inclusion criteria, all women should complain about hypertension problems (blood pressure of at least 140/90 mm Hg). Mothers with fetal death or multiple pregnancy (e.g. twins) were excluded from the study. Information about each mother was obtained from their clinical files. This information was extracted using a checklist that included the following variables: age, education, job, number of pregnancies, number of children, sex of the fetus, the season of pregnancy, underlying conditions including hypertension, kidney disease, heart disease and diabetes, and finally preeclampsia status (categorized as with or without preeclampsia).
2.2. Software
After collecting the information, approximately 70% of the total sample (1016 people) were used for training and about 30% of the remaining sample (435people) were used to test the models. The training data is used to build and train the model and the test data is used to assess the performance of the model to predict healthy or patient classes (in our study-with preeclampsia or without preeclampsia). Data were processed in the R 3.2.2 software environment. To build the models using the R software, the C50 package for C5.0 decision tree, e1071 package for SVM, random Forest package for RF model, and MASS package for LDA were used and their performance was compared using accuracy, sensitivity, and specificity criteria on the test data.
2.3. Ethical considerations
Details of the women were collected without including the name. In addition, individuals' information was kept confidential. The study was approved by the Vice-Chancellor for Research and Technology, Hamadan University of Medical Sciences, Hamadan, Iran (Code: 9505122624).
2.4. Statistical analysis
2.4.1. Logistic regression (LR)
LR is a standard method for binary classification. In LR, Y represents the binary response variable (in this study, Y = 1 for a subject with preeclampsia and Y = 0 for without preeclampsia) and X1, …, XP represent the vector features (in our study, clinical features of patients). In this case, the probability of Y = 1 (probability of belonging to the class of mothers with preeclampsia) was calculated as follows:
Based on this, the person would have been assigned to class 1 if P (Y = 1) > C and otherwise to class 0, where C was a fixed number (15, 16).
2.4.2. k-nearest neighborhood (k-NN)
The k-NN algorithm is a non-parametric method that is commonly used for classification and regression problems. It is one of the most widely used algorithms due to its simplicity and ease of implementation. In order to classify a new person into one of the healthy or patient classes (in our study - with preeclampsia or without preeclampsia) that displayed in the feature space with a point, k-NN calculates the distance between this point and the other points in the training dataset. Euclidean distance is usually used as the distance criterion. This distance between A and B was calculated as follows:
Then the point was assigned to a class in the k nearest neighborhood where k was an integer (17).
2.4.3. Linear discriminant analysis (LDA)
LDA is a classic classifier that uses a linear decision function for classification. In this method, a linear combination of independent variables (features) was used to separate the dependent variable classes in the best way. In other words, the goal was to find a linear function that maximized the probability of separation between the two groups. The conditional probability of independent variables given the label class was used to predict the label class of a new case. A function was used to maximize the distance between the mean of the groups so that the scatter within the classes was minimized and the scatter between classes was maximized (18).
2.4.4. Decision tree
The structure of the decision tree is similar to a tree, which includes roots, branches, and leaves. The classification tree divided the data (parent node) into two subsets (children node) using a split criterion. This division continued until we finally reached a homogeneous level of response in each node. In decision tree, the branches represent combinations of input features and the leaves represent the labels of the target class (in our study, 0 was the label of the without preeclampsia class and 1 was the label of the with preeclampsia class) (19).
The rules produced by the decision tree were explained using the logical terms "if" and "then". The decision trees that are most common are ID3, C4.5, C5.0 and CART (16). The C5.0 decision tree, which was introduced by Quinlan in 1987, is modified from the C4.5 version (20). C5.0 decision tree is faster than the C4.5 and produces more precise rules (21). Therefore, in this study, we used this type of decision tree.
2.4.5. Random forest (RF)
RF is an "ensemble learning" technique that involves a large number of decision trees whose variance is lower than that of a single decision tree. Each RF tree was based on a bootstrap sample that was randomly extracted from the original dataset and built using the CART method and the Decrease Gini Impurity split criterion (22).
2.4.6. Support vector machine (SVM)
SVM was introduced by Vapnik in 1979. Its goal is to find the best function for classification so that the members of the two classes (in our study-with preeclampsia or without preeclampsia) can be distinguished in the dataset. Assuming that the classes are linearly separable, to separate the classes, a hyperplane with a maximum margin is created (23). But in cases where the input dataset is not linearly separable, using the kernel function the data are mapped to the feature space with a high dimension so that they can be separated linearly in this new space. The most common kernel functions used in SVM are linear, polynomial, and radial basis function (RBF) kernel. In this study, we used the RBF kernel because it has more generalizability than other kernel functions (24). The equation we used for RBF kernel was as follows:
3. Results
Of the 1452 pregnant women in this study that underwent prenatal care, 726 subjects were diagnosed with preeclampsia, and 726 subjects were diagnosed without this condition. The mean age for mothers with preeclampsia (35.41 ± 7.91) was higher than the mean age for mothers without preeclampsia (34.53 ± 6.72) (p = 0.02). Most mothers in the preeclampsia group had blood type O (63.4%), while in the group without preeclampsia, the most common blood type was A (58.7%). Most mothers with preeclampsia had a male fetus (68.7%), and this percentage was found to be 58.9% for mothers without the disorder; this difference was statistically significant (p < 0.001).
Most mothers in the preeclampsia group (42.1%) had high blood pressure, and in the control group, the majority did not have any underlying conditions (82.2%). The highest frequency of preeclampsia was observed in March and the lowest in July, and there was a significant relationship between hot and cold months and preeclampsia (p < 0.001). The results of comparing the other variables in the two groups are reported in table I. All variables were entered into the LR model using the stepwise backward elimination method and the odds ratios for each variable are given in table II.
The rules derived from the C5.0 decision tree are stated in table III. Among the variables used in this study, the variables that contributed most to the extracted rules from the C5.0 decision tree were underlying conditions (100%), degree of education (21.44%), pregnancy season (44.55%) and the number of pregnancies (10.42%).
Based on the results from the RF model, the most important variable in predicting preeclampsia was the underlying conditions. Age, pregnancy season, number of pregnancies, and the number of children were other important variables in predicting preeclampsia. The order of factors that were important in predicting preeclampsia is reported in figure 1.
For the k-NN model, the highest accuracy was obtained for k = 21, and in the SVM model, the maximum accuracy for the RBF kernel function was obtained for the parameters C = 17034.19, ɣ = 0.3049167 (24).
To evaluate and compare the performance of the models proposed for the classification of mothers with vs. without preeclampsia, the models were performed on test data (n = 435). The performance evaluation criteria for the models, including accuracy, sensitivity, and specificity, were calculated using the following equation and the results are shown in table IV.
True positive (TP), true negative (TN), false positive (FP), and false negative (FN) were obtained from the classifier (24).
4. Discussion
Due to the serious risks that preeclampsia poses to the mother and fetus, it is important to use methods that can predict this outcome. However, despite recent advances in the etiology of preeclampsia, to date, no clinical screening tests have been identified to diagnose the disorder (25). Identifying the underlying and predictive factors of preeclampsia can play a significant role in reducing mortality and complications in the mother and fetus. In addition to identifying the risk factors associated with preeclampsia, this study aimed to compare common data mining approaches and select the strongest model to help professionals in this field. In this section, we will first consider the most important risk factors associated with preeclampsia and then discuss the performance of the data mining models.
According to the results of the univariate analysis (Table I), most mothers in the preeclampsia group had blood type O (63.4%). However, in the group without preeclampsia, most people had blood type A (58.7%). A study by Elmugabil also showed that mothers with blood type O were more at risk for eclampsia (26). The distribution of the sex of the fetus in the two groups was also significantly different (p < 0.001) so that most mothers in the preeclampsia group had a male fetus (68.7%). Among the models adopted in the present study, LR, C5.0 decision tree, and RF models, in addition to predicting the response variable (preeclampsia status), also identified the risk factors related to the condition. Based on the results of fitting these three models, the variables of underlying condition, age, pregnancy season, and number of pregnancies were the most important risk factors in diagnosing preeclampsia. In a study by Rezende and co-authors, a significant difference was obtained between the preeclampsia and control groups in terms of variables such as gestational age, chronic hypertension, and type 1 and type 2 diabetes, which is consistent with the results of the present study (27). In a study conducted by Farzaneh and co-workers to identify risk factors for preeclampsia, a history of hypertension was one of the main risk factors, but contrary to our study, there was no association between preeclampsia and age, number of pregnancies, or gestational age (28).
Based on the results of fitting the data mining models, the accuracy with the test data was as follows: SVM (0.791), C5.0 (0.788), RF (0.758), k-NN (0.742), LR (0.0713), LDA (0.687). Therefore, according to the obtained results, SVM had the highest accuracy among the fitted models. In a study conducted by Asfaw to predict diabetes, the SVM model had the highest accuracy among the six data mining models that were used, which included SVM, decision tree, RF, Naïve Bayes, LR, and k-NN (29). But this result is inconsistent with a study conducted by Basu et al. to diagnose breast cancer where RF had the highest accuracy (92.98%) among the classification methods decision tree, SVM, k-NN, and RF; SVM was in second place with an accuracy of 61.403%, and k-NN had the lowest accuracy (30). In fact, in most data mining studies, there is close competition between the SVM and RF models so that in some studies, SVM accuracy exceeds RF (29), and in other cases, the opposite is true (30). In the present study, after SVM, C5.0 decision tree and RF also performed well. One of the advantages of C5.0 decision tree and RF was that these models, in addition to predicting with acceptable accuracy, were also able to identify risk factors affecting the condition whereas this advantage did not exist for SVM, k-NN, and LDA. Another advantage of the decision tree model was that it provided an intuitive image of the impact of risk factors by presenting a series of rules.
In our study, the LDA model had the least predictive accuracy, which is inconsistent with the results of a study conducted by Maroco and colleagues to predict dementia by comparing artificial neural network, SVM, RF, LR, and decision tree models; in this study, LDA was the most accurate model after SVM and RF (31). In our study, after LDA, the LR model had the lowest ability to diagnose patients with preeclampsia (accuracy = 0.713). This is inconsistent with the results of a study in which the LR model had the highest diagnostic power in predicting breast cancer compared to models such as Naïve Bayes, k-NN, Ada Boost, and decision tre e-J 48 (32). However, the LR model had the advantage that, by interpreting the coefficients in this model and also calculating the value of the odds ratios, the effect of each variable on the response variable (preeclampsia) could be calculated and interpreted. This advantage did not exist in the other classification methods. For example, for the degree of education variable, an odds ratio of 1.55 was obtained (Table II). This means that having an academic education compared with education less than diploma increased the chances of developing preeclampsia by 0.55.
One of the limitations of the present study was the potential recall bias, because pregnant mothers may not remember much of the information about pregnancy; this is an unavoidable error in data collection in such studies. Finally, it is recommended that these models be used on more genetic and clinical risk factors to achieve higher diagnostic power.
5. Conclusion
Among the data mining models employed in this study, the SVM model had the highest prediction accuracy. Therefore, we can conclude that this model can be used as a screening tool to help predict preeclampsia. Based on the results of the RF model, which also showed good performance in this study, the variables of underlying condition, degree of education, pregnancy season, and the number of pregnancies were the most important risk factors associated with preeclampsia. Therefore, by controlling these factors and also regularly monitoring the blood pressure of mothers with these risk factors, the potential risks associated with this syndrome can be reduced.
Acknowledgments
The study was funded by the Vice-Chancellor for Research and Technology, Hamadan University of Medical Sciences, Hamadan, Iran (No. 9505122624). This article is taken from the research project (No. 9505122624) approved by the ethics committee of Hamadan University of Medical Sciences in 2020-09-20.
Conflict of Interest
The authors declare that they have no conflict of interest.
Type of Study: Original Article |
Subject:
Pregnancy Health
References
1. Beltran AJ, Wu J, Laurent O. Associations of meteorology with adverse pregnancy outcomes: A systematic review of preeclampsia, preterm birth and birth weight. Int J Environ Res Public Health 2014; 11: 91-172. [DOI:10.3390/ijerph110100091] [PMID] [PMCID]
2. Green P. Update in the diagnosis and management of hypertensive disorders in pregnancy. Michigan: Wayne State University School of Medicine; 2014.
3. Sibai B, Dekker G, Kupferminc M. Pre-eclampsia. Lancet 2005; 365: 785-799.
https://doi.org/10.1016/S0140-6736(05)71003-5 [DOI:10.1016/S0140-6736(05)17987-2]
4. Mol BWJ, Roberts CT, Thangaratinam Sh, Magee LA, de Groot ChJ, Hofmeyr GJ. Pre-eclampsia. Lancet 2016; 387: 999-1011. [DOI:10.1016/S0140-6736(15)00070-7]
5. Ananth CV, Keyes KM, Wapner RJ. Pre-eclampsia rates in the United States, 1980-2010: Age-period-cohort analysis. BMJ 2013; 347: f6564. [DOI:10.1136/bmj.f6564] [PMID] [PMCID]
6. Saleem S, McClure EM, Goudar ShS, Patel A, Esamai F, Garces A, et al. A prospective study of maternal, fetal and neonatal deaths in low-and middle-income countries. Bull World Health Organ 2014; 92: 605-612. [DOI:10.2471/BLT.13.127464] [PMID] [PMCID]
7. Shahgheibi Sh, Rezaie M, Kamangar TM, Zarea Sh, Yousefi SR. The effect of season on the prevalence of preeclampsia. J Clin Gynecol Obstet 2016; 5: 81-84. [DOI:10.14740/jcgo408w]
8. Kharaghani R, Cheraghi Z, Okhovat Esfahani B, Mohammadian Z, Nooreldinc RS. Prevalence of preeclampsia and eclampsia in Iran. Arch Iran Med 2016; 19: 64-71. [DOI:10.5812/ircmj.40856]
9. Omani-Samani R, Ranjbaran M, Amini P, Esmailzadeh A, Sepidarkish M, Almasi-Hashiani A. Adverse maternal and neonatal outcomes in women with preeclampsia in Iran. J Matern Fetal Neonatal Med 2019; 32: 212-216. [DOI:10.1080/14767058.2017.1376643] [PMID]
10. Guleria P, Sood M. Data mining in education: A review on the knowledge discovery perspective. Int J Data Min Knowledge Manage Proc 2014; 4: 47-60. [DOI:10.5121/ijdkp.2014.4504]
11. Frizzell JD, Liang L, Schulte PJ, Yancy CW, Heidenreich PA, Hernandez AF, et al. Prediction of 30-day all-cause readmissions in patients hospitalized for heart failure: Comparison of machine learning and other statistical approaches. JAMA Cardiol 2017; 2: 204-209. [DOI:10.1001/jamacardio.2016.3956] [PMID]
12. Nalluri S, Saraswathi RV, Ramasubbareddy S, Govinda K, Swetha E. Chronic heart disease prediction using data mining techniques. In: Raju KS, Senkerik R, Lapka Sp, Rajagopal V. Data engineering and communication technology. New York: Springer; 2020. 903-912. [DOI:10.1007/978-981-15-1097-7_76]
13. Zhang Y, Xin Y, Li Q, Ma J, Li Sh, Lv X, et al. Empirical study of seven data mining algorithms on different characteristics of datasets for biomedical classification applications. Biomed Eng Online 2017; 16: 125. [DOI:10.1186/s12938-017-0416-x] [PMID] [PMCID]
14. Ricciardi C, Valente AS, Edmund K, Cantoni V, Green R, Fiorillo A, et al. Linear discriminant analysis and principal component analysis to predict coronary artery disease. Health Inform J 2020; 26: 2181-2192. [DOI:10.1177/1460458219899210] [PMID]
15. Peng H, Liang D, Choi C. Evaluating parallel logistic regression models. 2013 IEEE International Conference on Big Data. USA: IEEE; 2013 October 6-9. 119-126. [DOI:10.1109/BigData.2013.6691743]
16. Manoochehri Z, Rezaei M, Salari N, Khazaie H, Khaledi Paveh B, Manoochehri S. The prediction of obstructive sleep apnea using data mining approaches. Arch Iran Med 2018; 21: 460-465.
17. Cover TM, Hart PE. Nearest neighbor pattern classification. IEEE Transact Inform Theory 1967; 13: 21-27. [DOI:10.1109/TIT.1967.1053964]
18. Izenman AJ. Modern multivariate statistical techniques: Regression, classification and manifold learning. Switzerland: Springer; 2013.
19. Shaikhina T, Lowe D, Daga S, Briggs D, Higgins R, Khovanova N. Decision tree and random forest models for outcome prediction in antibody incompatible kidney transplantation. Biomed Signal Proc Control 2019; 52: 456-462. [DOI:10.1016/j.bspc.2017.01.012]
20. Quinlan JR. Induction of decision trees. Machine Learn 1986; 1: 81-106.
https://doi.org/10.1007/BF00116251 [DOI:10.1023/A:1022643204877]
21. RuleQuest RP. Is See5/C5. 0 better than C4. 5. St Ive, Australia. 2009.
22. Breiman L. Random forests. Machine Learn 2001; 45: 5-32.
https://doi.org/10.1023/A:1017934522171 [DOI:10.1023/A:1010933404324]
23. Tamura H, Tanno K. Midpoint validation method for support vector machines with margin adjustment technique. Int J Innovat Comput Inform Control 2009; 5: 4025-4032.
24. Manoochehri Z, Salari N, Rezaei M, Khazaie H, Manoochehri S, Khaledi Pavah B. Comparison of support vector machine based on genetic algorithm with logistic regression to diagnose obstructive sleep apnea. J Res Med Sci 2018; 23: 65. [DOI:10.4103/jrms.JRMS_357_17] [PMID] [PMCID]
25. English FA, Kenny LC, McCarthy FP. Risk factors and effective management of preeclampsia. Integr Blood Press Control 2015; 8: 7-12. [DOI:10.2147/IBPC.S50641] [PMID] [PMCID]
26. Elmugabil A, Rayis DA, Ahmed MA, Adam I, Gasim GI. O blood group as risk factor for preeclampsia among Sudanese women. Open Access Maced J Med Sci 2016; 4: 603-606. [DOI:10.3889/oamjms.2016.108] [PMID] [PMCID]
27. Rezende KBdC, Cunha AJLAd, Pritsivelis C, Faleiro EC, Amim Junior J, Bornia RG. How do maternal factors impact preeclampsia prediction in Brazilian population? J Matern Fetal Neonatal Med 2019; 32: 1051-1056. [DOI:10.1080/14767058.2017.1399115] [PMID]
28. Farzaneh F, Tavakolikia Z, Soleimanzadeh Mousavi SH. Assessment of occurrence of preeclampsia and some clinical and demographic risk factors in Zahedan city in 2017. Clin Exp Hypertens 2019; 41: 583-588. [DOI:10.1080/10641963.2018.1523919] [PMID]
29. Asfaw TA. Prediction of diabetes mellitus using machine learning techniques. Int J Comput Engin Technol 2019; 10: 25-32. [DOI:10.34218/IJCET.10.4.2019.004]
30. Basu A, Roy R, Savitha N. Performance analysis of regression and classification models in the prediction of breast cancer. Indian J Sci Technol 2018; 11: 1-6. [DOI:10.17485/ijst/2018/v11i3/119179]
31. Maroco J, Silva D, Rodrigues A, Guerreiro M, Santana I, de Mendonça A. Data mining methods in the prediction of Dementia: A real-data comparison of the accuracy, sensitivity and specificity of linear discriminant analysis, logistic regression, neural networks, support vector machines, classification trees and random forests. BMC Res Notes 2011; 4: 299. [DOI:10.1186/1756-0500-4-299] [PMID] [PMCID]
Send email to the article author
| Rights and permissions | |
 |
This work is licensed under a Creative Commons Attribution-NonCommercial 4.0 International License. |