
International Journal of
Reproductive Biomedicine
Mon, Aug 3, 2026
[Archive]
Volume 23, Issue 11 (November 2025)
IJRM 2025, 23(11): 897-910 |
Back to browse issues page


Ethics code: IR.NUMS.REC.1402.002
![]()
![]()
![]()
Download citation:
BibTeX | RIS | EndNote | Medlars | ProCite | Reference Manager | RefWorks
Send citation to:


BibTeX | RIS | EndNote | Medlars | ProCite | Reference Manager | RefWorks
Send citation to:
Babaei K, Morovat S, Mozdarani H, Naghdipour Mirsadeghi M, Mirhafez S R, Mirzajani E, et al . Integrative RNA‑seq analysis reveals immune‑related hub genes NR4A1 and FOSB in recurrent spontaneous abortion: A bioinformatics study. IJRM 2025; 23 (11) :897-910
URL: http://ijrm.ir/article-1-3457-en.html
URL: http://ijrm.ir/article-1-3457-en.html
Kosar Babaei1 

 , Saman Morovat2 , Hossein Mozdarani3 , Misa Naghdipour Mirsadeghi4 , Seyed Reza Mirhafez1 , Ebrahim Mirzajani5 , Mohsen Aziminezhad6 , Ali Akbar Samadani *7
, Saman Morovat2 , Hossein Mozdarani3 , Misa Naghdipour Mirsadeghi4 , Seyed Reza Mirhafez1 , Ebrahim Mirzajani5 , Mohsen Aziminezhad6 , Ali Akbar Samadani *7
1- Noncommunicable Diseases Research Center, Neyshabur University of Medical Sciences, Neyshabur, Iran.
2- Department of Medical Genetics and Molecular Biology, Faculty of Medicine, Iran University of Medical Sciences (IUMS), Tehran, Iran.
3- Department of Medical Genetics, Faculty of Medical Sciences, Tarbiat Modares University, Tehran, Iran.
4- Department of Gynecology, School of Medicine, Reproductive Health Research Center, Alzahra Hospital, Guilan University of Medical Sciences, Rasht, Iran.
5- Department of Biochemistry and Biophysics, School of Medicine, Guilan University of Medical Sciences, Rasht, Iran.
6- Healthy Ageing Research Center, Neyshabur University of Medical Sciences, Neyshabur, Iran. & Noncommunicable Diseases Research Center, Neyshabur University of Medical Sciences, Neyshabur, Iran. UMR INSERM U 1122, Gene-Environment Interactions in Cardiovascular Pathophysiology (IGE-PCV), University of Lorraine, Nancy, France.
7- Guilan Road Trauma Research Center, Trauma Institute, Guilan University of Medical Sciences, Rasht, Iran. ,drsamadani@gums.ac.ir; a.a.hormoz@gmail.com
2- Department of Medical Genetics and Molecular Biology, Faculty of Medicine, Iran University of Medical Sciences (IUMS), Tehran, Iran.
3- Department of Medical Genetics, Faculty of Medical Sciences, Tarbiat Modares University, Tehran, Iran.
4- Department of Gynecology, School of Medicine, Reproductive Health Research Center, Alzahra Hospital, Guilan University of Medical Sciences, Rasht, Iran.
5- Department of Biochemistry and Biophysics, School of Medicine, Guilan University of Medical Sciences, Rasht, Iran.
6- Healthy Ageing Research Center, Neyshabur University of Medical Sciences, Neyshabur, Iran. & Noncommunicable Diseases Research Center, Neyshabur University of Medical Sciences, Neyshabur, Iran. UMR INSERM U 1122, Gene-Environment Interactions in Cardiovascular Pathophysiology (IGE-PCV), University of Lorraine, Nancy, France.
7- Guilan Road Trauma Research Center, Trauma Institute, Guilan University of Medical Sciences, Rasht, Iran. ,
Keywords: Spontaneous abortion, Gene expression profiling, Protein interaction mapping, FOSB, NR4A1.
Full-Text [PDF 2704 kb]
(562 Downloads)
| Abstract (HTML) (748 Views)
Full-Text: (111 Views)
1. Introduction
Recurrent spontaneous abortion (RSA) is a reproductive disease characterized by the spontaneous cessation of 2 or more gestations from the 20th wk of gestation (1). Historically, recurrent pregnancy loss was defined as 3 or more successive losses with the same spouse. Nonetheless, given that the chance of recurrence is similar in people who have experienced 2 or 3 losses, current guidelines from the European Society of Human Reproduction and Embryology and the American Society for Reproductive Medicine suggest that an assessment can be made following 2 consecutive miscarriages (2, 3). RSA affects around 1-5% of women of fertile age, constituting a substantial therapeutic concern (4).
Despite advances in elucidating the fundamental causes of RSA, the precise molecular pathways involved in its pathogenesis remain poorly understood. The development of innovative treatment approaches to improve pregnancy outcomes for affected women requires identifying and analyzing the prominent molecular actors implicated in RSA.
Recent breakthroughs in omics technologies have enabled a more thorough exploration of the molecular pathways underlying complex disorders such as RSA (5, 6). An essential technique for analyzing gene expression patterns across several tissues or cellular types, such as the decidua and villus, which are crucial for the preservation of early pregnancy, is transcriptome analysis (7-9). Transcriptome analysis has emerged as a critical technique for investigating gene expression patterns in diverse tissues and cell types, including the decidua and villus, which are vital for sustaining early pregnancy. By combining information from multiple transcriptomic studies or datasets, in-silico transcriptome analysis enhances this method and provides a more thorough understanding of changes in gene expression. This integrative method facilitates the identification of shared molecular mechanisms, biomarkers, and biological pathways, yielding insights into potential treatment targets for RSA (10-12). Researchers can develop targeted treatments by gaining a comprehensive understanding of the complex molecular landscape associated with RSA through these advanced methodologies. In decidua and villus tissues from RSA patients, common differentially expressed genes (DEGs) are to be identified.
In this study, we integrated high-throughput RNA-seq datasets from decidua (GSE113790) and villus (GSE121950) tissues to perform a comprehensive bioinformatics analysis of RSA, a complex miscarriage disorder often linked to immune dysregulation at the maternal-fetal interface. After stringent batch correction using surrogate variable analysis (SVA) to mitigate technical variation, we identified DEGs with high confidence (|log₂FC| ≥ 2, false discovery rate [FDR] < 0.05). These DEGs were used to construct a high-confidence protein-protein interaction (PPI) network, followed by functional enrichment analysis to explore immune and extracellular matrix pathways. We then applied multiple centrality algorithms (maximum neighborhood component [MCC], density of maximum neighborhood component [DMNC], and maximal clique centrality [MNC]) to identify consensus hub genes and validate their expression across merged datasets. Finally, we highlighted NR4A1 and FOSB as key regulatory hubs and delineated targeted future directions, including experimental validation, single-cell profiling, mechanistic modelling, and cell functional assays, to clarify their mechanistic roles in RSA pathogenesis.
2. Materials and Methods
2.1. RNA sequencing data acquisition
In this bioinformatics study, 2 RNA sequencing datasets were collected from the gene expression omnibus (GEO) (13) database to examine DEGs in RSA. The datasets GSE113790 and GSE121950, both obtained from illumina HiSeq 2000 (Homo sapiens), comprised samples from decidua and villus tissues, respectively. GSE113790 comprised 6 decidua samples (3 from RSA patients and 3 from induced abortion controls), while GSE121950 included 6 villus samples (3 from RSA patients and 3 from controls). Data retrieval was executed utilizing the GEOquery package in R (version 4.3.1) (14). This study was conducted over 1 yr. Raw integer count matrices aligned to GRCh38.p13 and gene annotations were downloaded and merged with common gene IDs.
2.2. Batch correction using SVA
To adjust for hidden technical variation between datasets, SVAs were estimated using the SVA package svaseq, employing a full model including the biological group (RSA vs. control) and a reduced model excluding it (15). Genes with low mean (≤ 1) or zero variance were omitted before SVA to prevent density estimation errors. We retained the SV count to avoid overfitting. In addition, the ComBat function from the sva package was applied to reduce batch effects associated with the dataset origin. It should be noted that although the 2 integrated datasets (decidua and villus) represent distinct tissue types, there is currently no evidence indicating that these tissues are associated with distinct etiologies in RSA. Therefore, our analysis was designed to identify shared molecular signatures between decidua and villus tissues rather than to investigate tissue-specific effects. The batch correction was performed to minimize technical variation and enhance comparability across studies while preserving genuine biological signals related to RSA.
2.3. Evaluation of gene expression levels
Before conducting DEG analysis, low-count genes were filtered to include only those with at least 10 counts in the smallest sample group. Normalization and size-factor estimation (16) were performed using the DESeq2 default pipeline. DESeq2 (version 1.40.2) (17) was utilized to conduct differential expression analysis via the Wald test (17, 18), establishing statistical significance with an adjusted p < 0.05 (Benjamini-Hochberg) and |log2FoldChange| ≥ 2. Multiple-test corrections were performed using the FDR method (19). DEGs were ranked according to their significance, and those that met the criteria were classified as significant DEGs.
2.4. PPI network construction
A subset of 114 shared protein-coding DEGs was mapped to their corresponding STRING protein identifiers using STRING v12 (20). STRING consolidates established and anticipated interactions from multiple sources, encompassing genomic context, experimental data, co-expression, text mining, and pre-existing databases. A high-confidence PPI network was generated by restricting interactions to those with a combined confidence score > 0.7. Disconnected nodes without any retained interactions were removed to focus the analysis on the most relevant interaction module.
2.5. Functional enrichment analysis
The refined PPI network was analyzed for functional enrichment using the integrated STRING enrichment tool, employing default genome-wide background parameters and hypergeometric testing (21). Enrichment terms were considered statistically significant based on the following criteria: an FDR of ≤ 0.05, adjusted by the Benjamini-Hochberg procedure; a strength metric ≥ 0.25, defined as the log₁₀ ratio of observed to expected counts, representing the magnitude of fold enrichment; and a signal value ≥ 0.25, calculated as the harmonic mean of the enrichment strength and the negative logarithm of the FDR (-log₁₀ [FDR]), providing a balance between enrichment magnitude and statistical confidence. Annotation terms included “count in network/background”, indicating how many of our DEG proteins matched the term vs. the total annotated proteins, providing both specificity and coverage information.
2.6. Hub gene identification
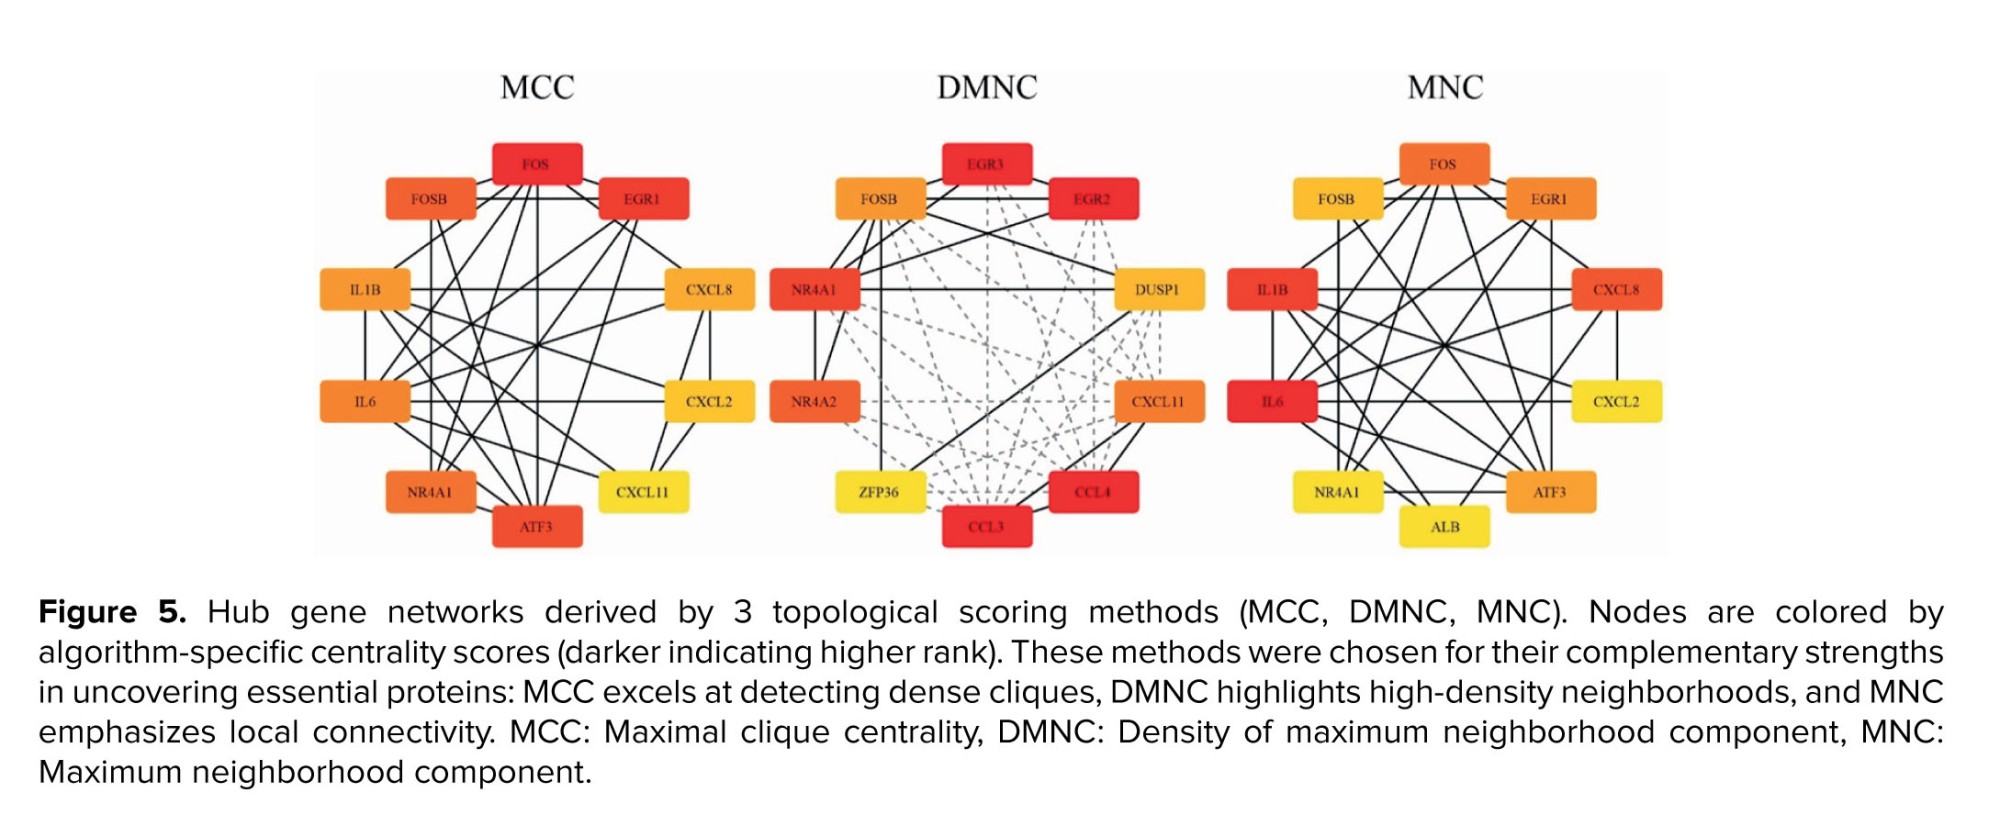
To pinpoint the most central regulators within the refined PPI network, hub genes were identified through the CytoHubba (22) plugin in Cytoscape (version 2.10.2) (23), a bioinformatics platform that facilitates the visualization of molecular interaction networks and the integration of diverse data types, such as gene expression profiles. CytoHubba facilitates the analysis of biological networks by identifying critical nodes, such as proteins or genes, using topological algorithms. This study employed 3 complementary metrics: MCC which measures the number and size of maximal cliques that include a given node; nodes within large, dense cliques are prioritized, making MCC one of the most accurate predictors of essential proteins. DMNC, which scores nodes based on the density of their most well-connected neighbors, helping uncover embedded hub modules that may not have the highest degree, and MNC, which quantifies the size of the most significant connected component in a node’s immediate neighborhood, effectively evaluating local connectivity without clique-level density. The top 10 genes from each ranking method were selected, and consensus hub genes were defined as those familiar across all 3 lists, thereby enhancing robustness through cross-validation across multiple centrality perspectives.
2.7. Gene xxpression visualization and network analysis
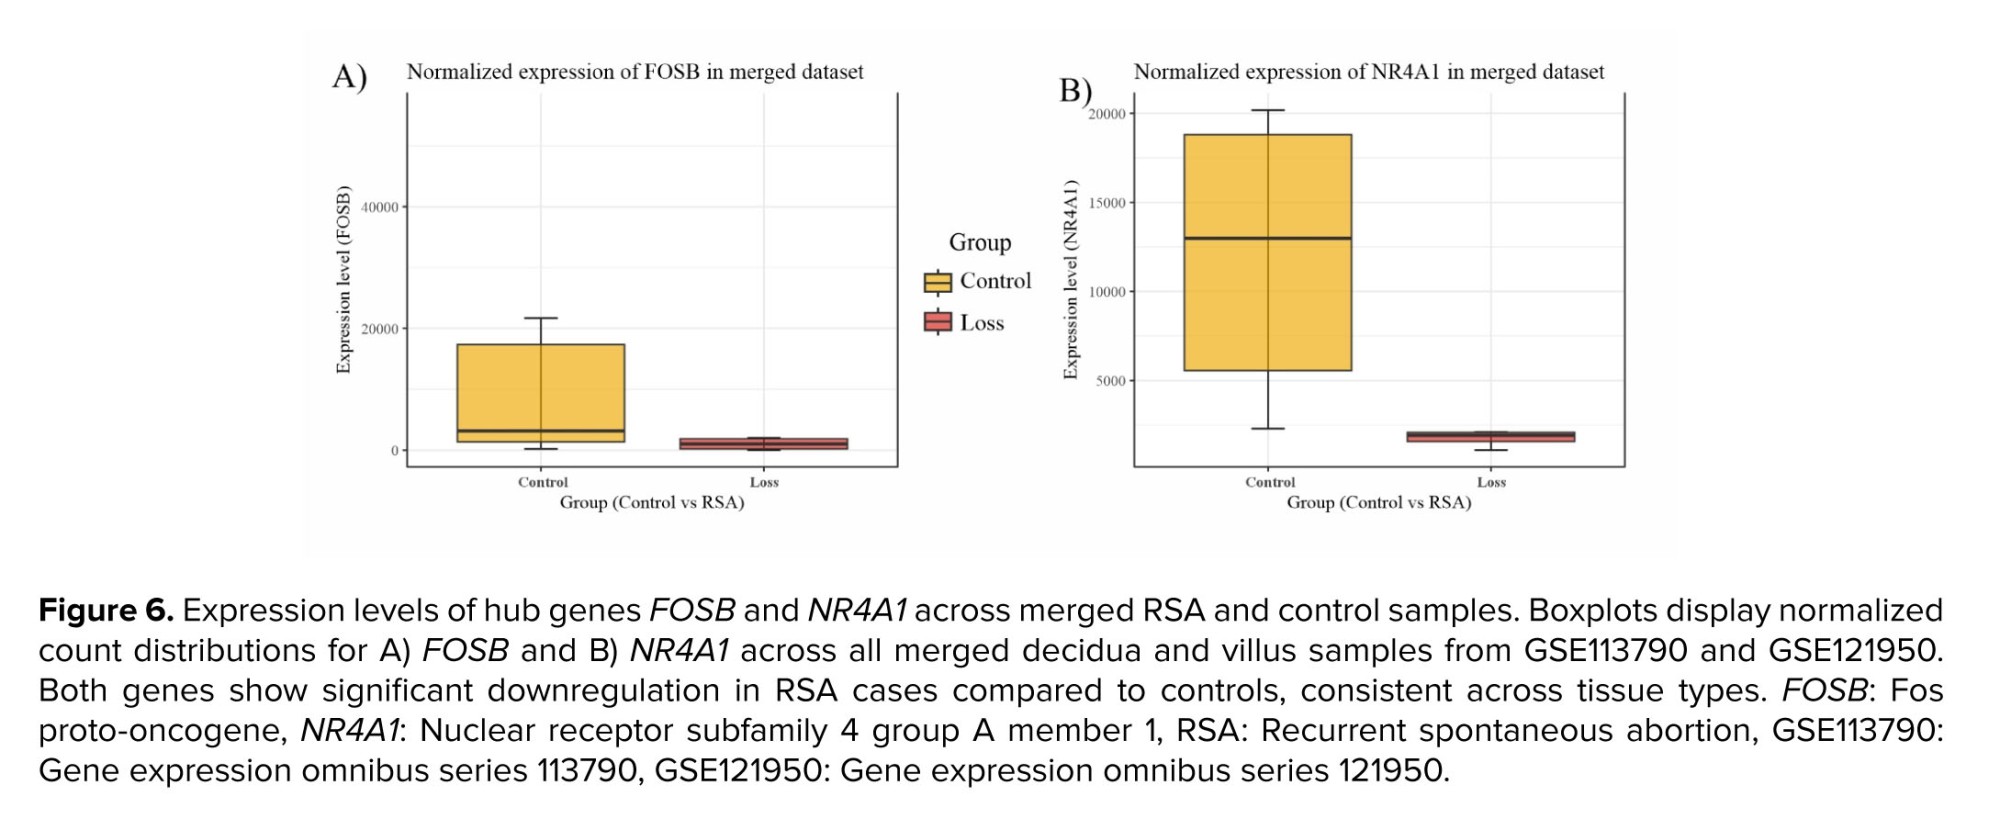
After merging normalized count data from both GSE113790 and GSE121950 into a single unified dataset, we plotted boxplots for the hub genes NR4A1 and FOSB using the combined data matrix. These plots, showing median, interquartile ranges, and outliers, contrast RSA vs. control across all samples (decidua and villus), highlighting consistent gene expression differences in the merged dataset context.
All differential expression statistics were computed using DESeq2 (v1.40.2), applying the Wald test and standard normalization procedures. Genes were defined as significantly differentially expressed with |log₂FoldChange| ≥ 2 and an adjusted p < 0.05 (Benjamini-Hochberg FDR correction).
2.8. Ethical Considerations
This study was supported by Neyshabur University of Medical Sciences, Neyshabur, Iran (Code: IR.NUMS.REC.1402.002), and also by the Guilan University of Medical Sciences, Rasht, Iran.
3. Results
3.1. Batch effect identification
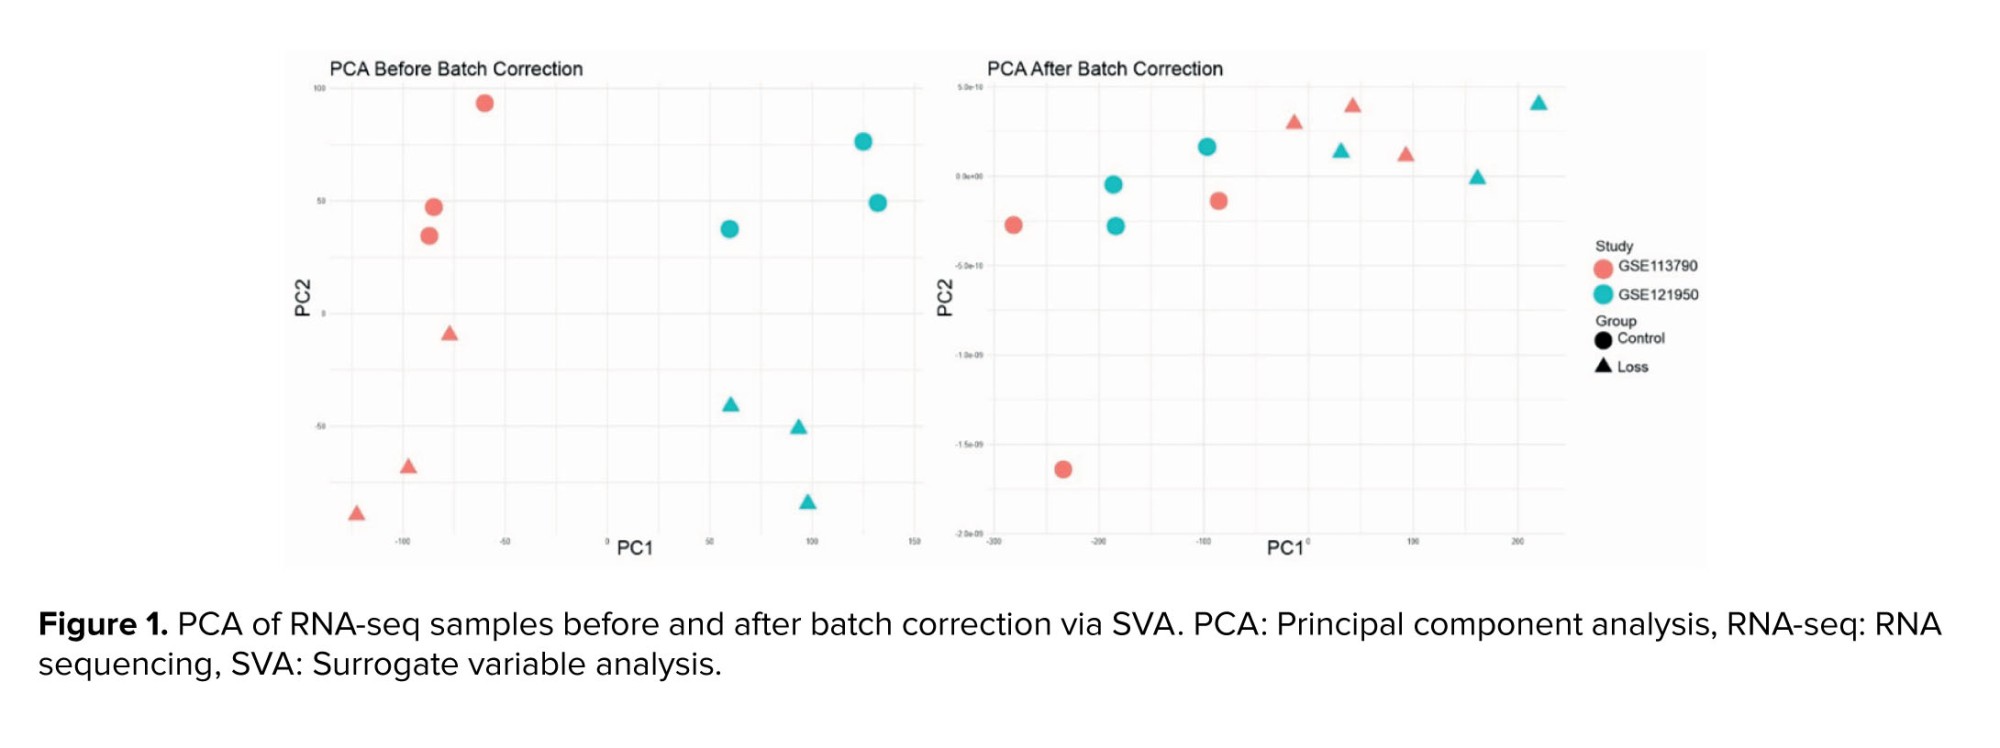
Uncorrected principal component analysis (PCA) revealed sample clustering predominantly by dataset rather than biological group, confirming inter-study batch effects. After incorporating study and SV covariates into the design, PCA axes clearly separated samples by RSA status, confirming that batch effects were effectively accounted for (Figure 1).
3.2. DEGs
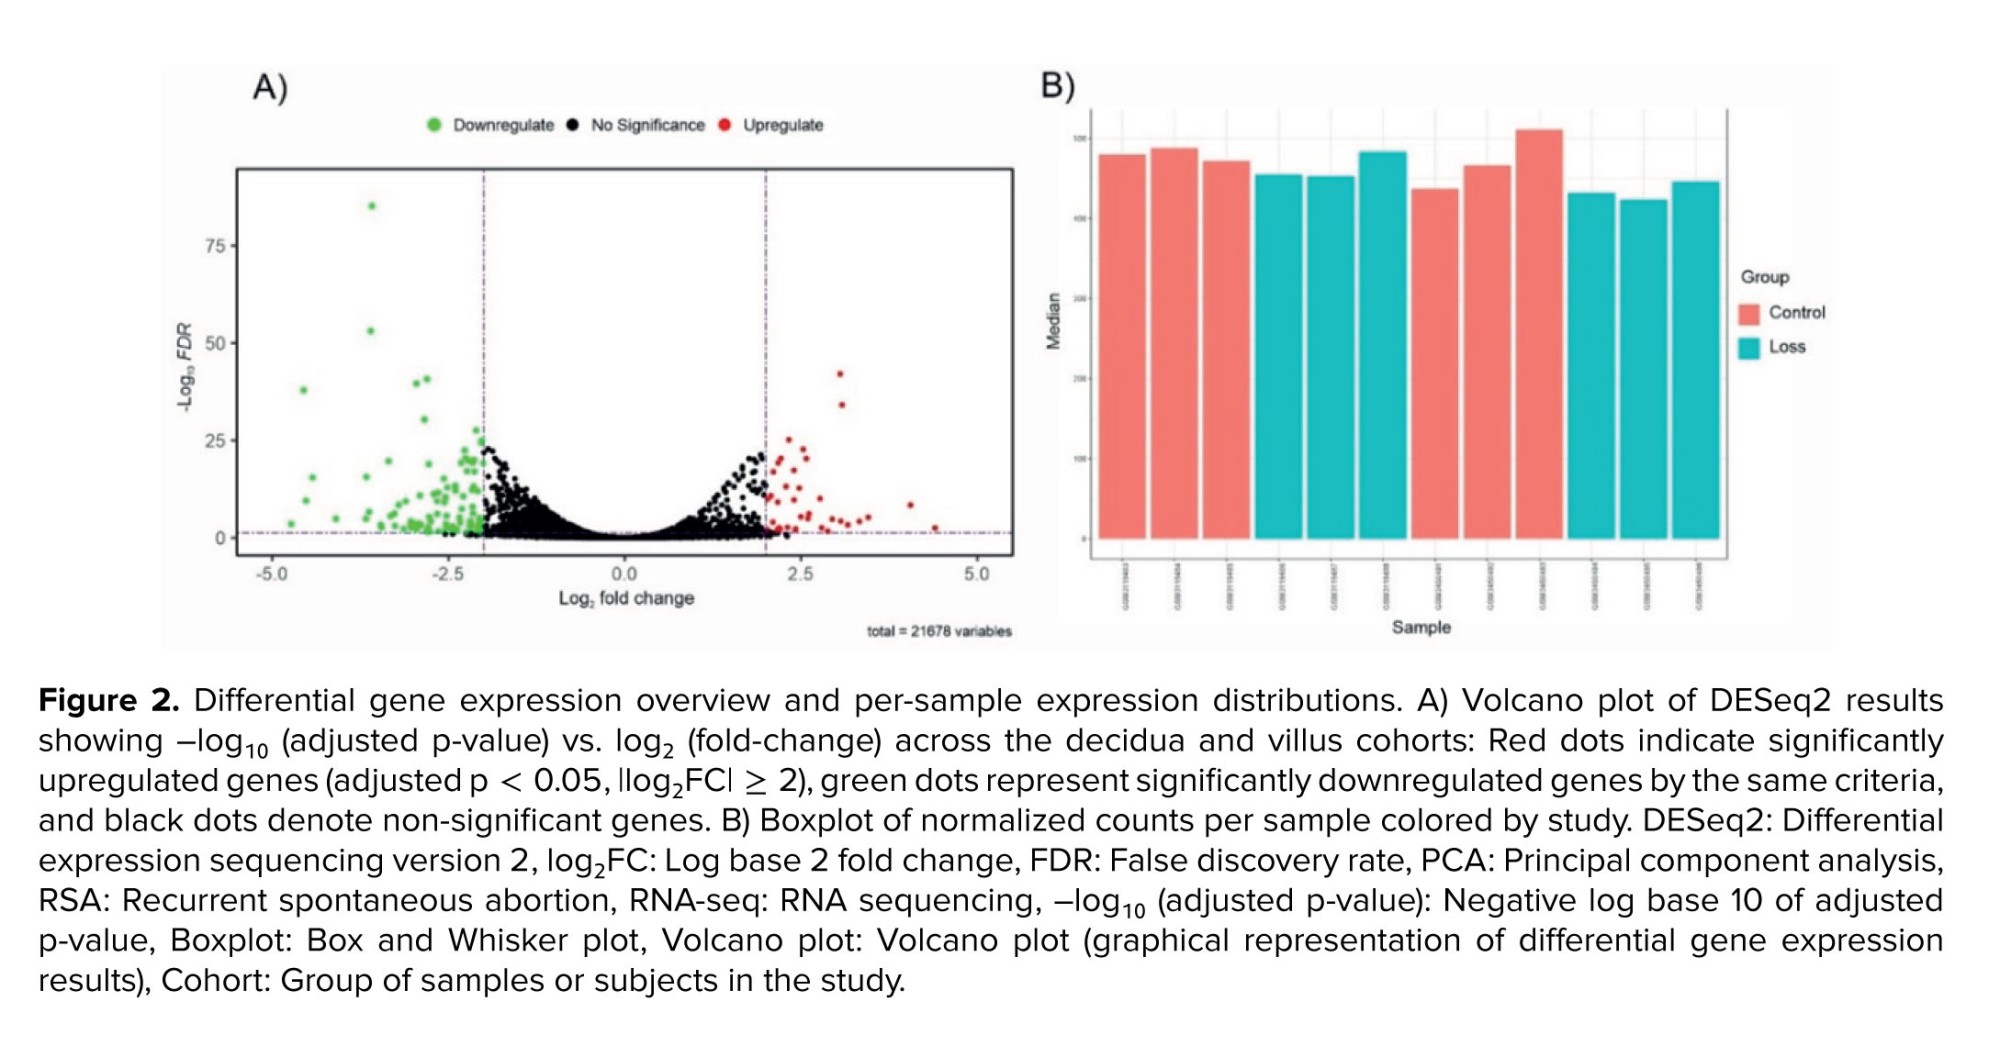
Post-batch-correction DESeq2 analysis identified 138 differentially expressed RNAs across the combined decidua and villus datasets. These included 13 non-coding RNAs, 114 protein-coding genes (DEGs), 3 pseudogenes, 4 ribosomal RNAs (rRNAs), and one small cytoplasmic RNA. For downstream analyses, only 114 protein-coding DEGs were retained. Among these, 30 genes were upregulated and 84 were downregulated in RSA samples compared to controls (Figure 2).
3.3. Analysis of PPI networks
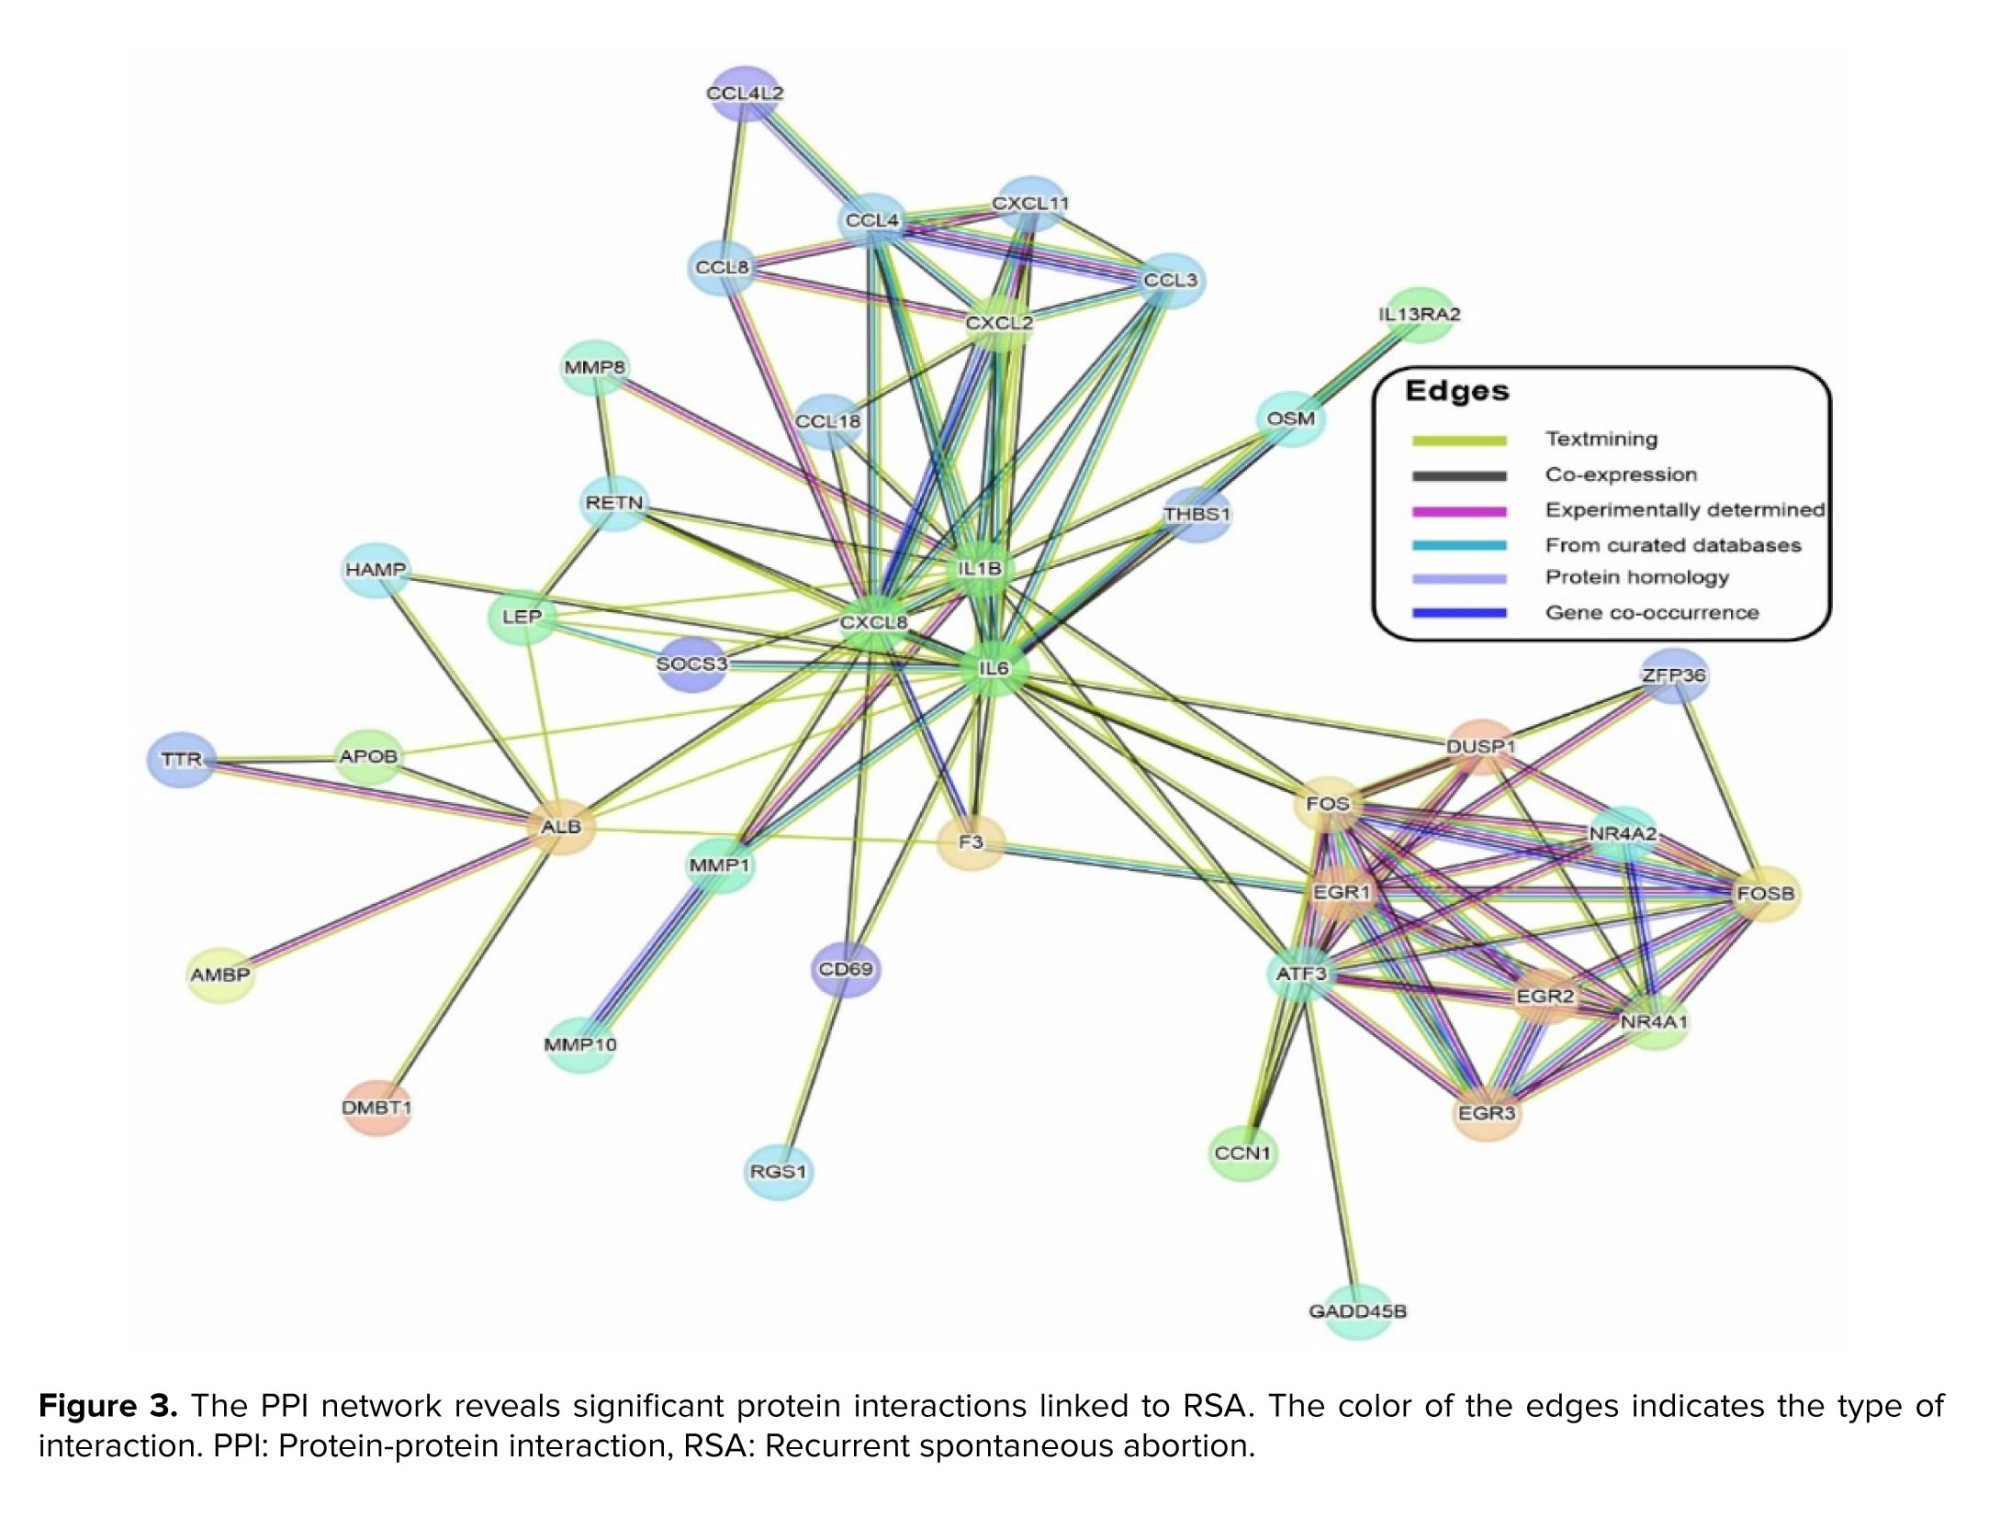
To explore the functional associations among the identified differentially expressed protein-coding genes, a PPI network was constructed using the STRING database with a high-confidence interaction score threshold. After removing disconnected nodes, the resulting core network comprised 101 nodes and 116 edges, with an average node degree of 2.3. Notably, the PPI enrichment p < 1.0e-16, indicating that the observed network exhibits significantly more interactions than expected by chance for a random set of proteins of similar size and degree distribution. This enrichment strongly suggests that the proteins are not acting independently but are functionally associated, implying their participation in standard biological processes (BP) relevant to RSA pathophysiology (Figure 3).
3.4. Functional enrichment of the PPI network
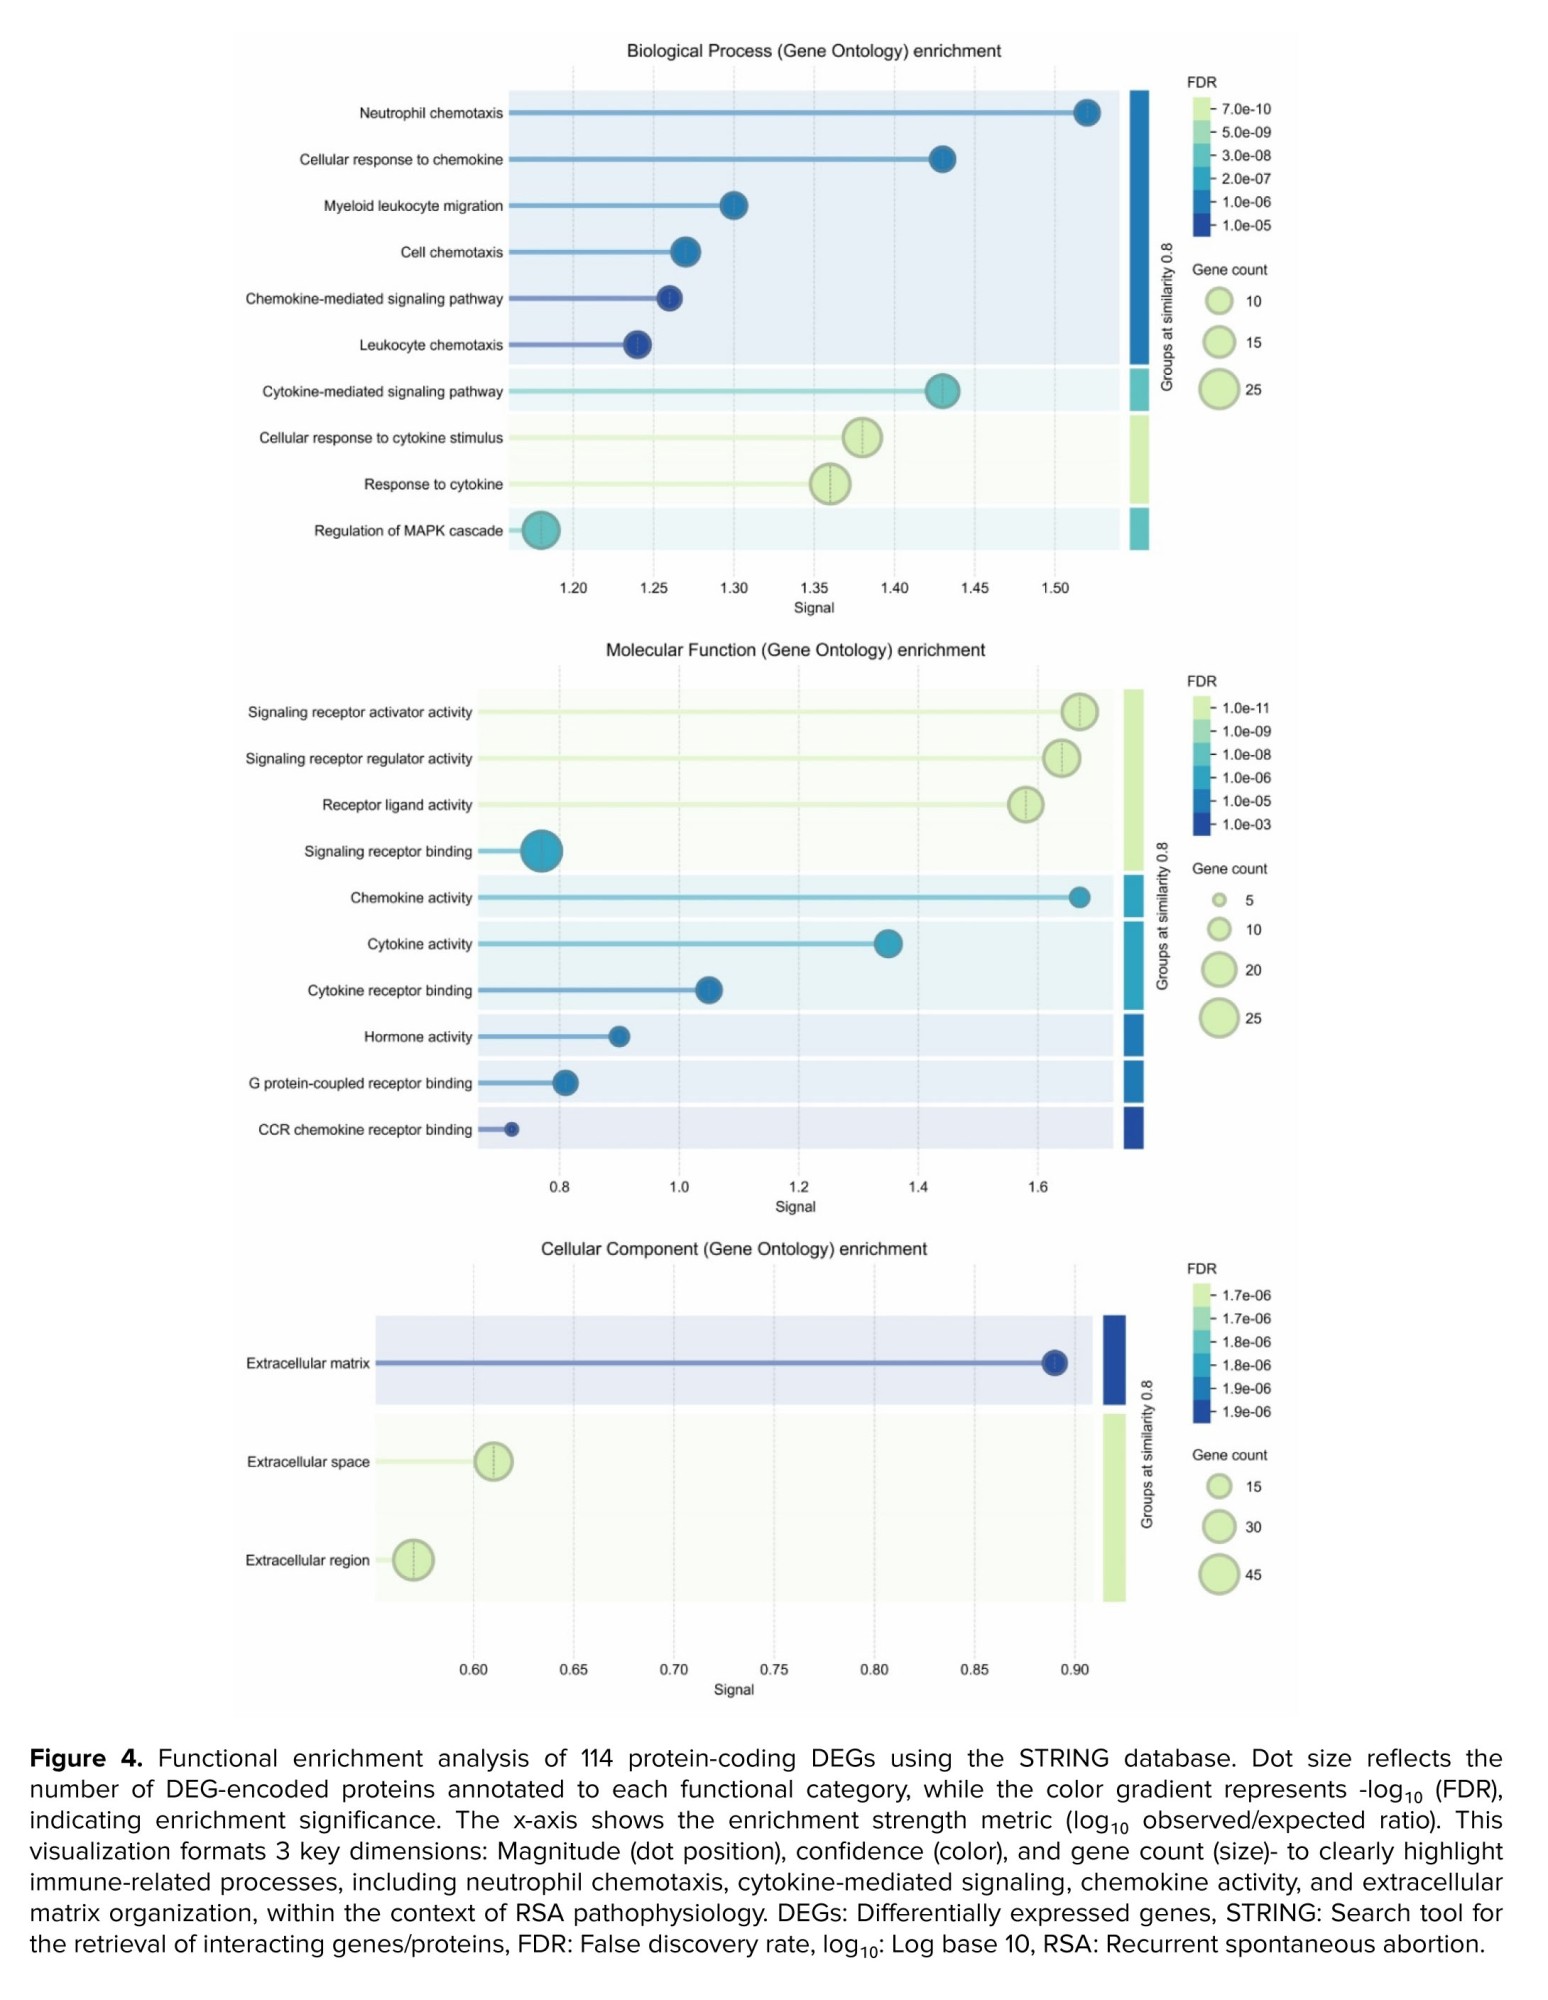
STRING-based enrichment analysis revealed multiple gene ontology (GO) terms across BP, molecular functions (MF), and cellular components (CC) that satisfied the predefined significance thresholds (FDR ≤ 0.05, strength ≥ 0.25, signal ≥ 0.25) (Figure 4). Notable enriched terms include (Table I):
Recurrent spontaneous abortion (RSA) is a reproductive disease characterized by the spontaneous cessation of 2 or more gestations from the 20th wk of gestation (1). Historically, recurrent pregnancy loss was defined as 3 or more successive losses with the same spouse. Nonetheless, given that the chance of recurrence is similar in people who have experienced 2 or 3 losses, current guidelines from the European Society of Human Reproduction and Embryology and the American Society for Reproductive Medicine suggest that an assessment can be made following 2 consecutive miscarriages (2, 3). RSA affects around 1-5% of women of fertile age, constituting a substantial therapeutic concern (4).
Despite advances in elucidating the fundamental causes of RSA, the precise molecular pathways involved in its pathogenesis remain poorly understood. The development of innovative treatment approaches to improve pregnancy outcomes for affected women requires identifying and analyzing the prominent molecular actors implicated in RSA.
Recent breakthroughs in omics technologies have enabled a more thorough exploration of the molecular pathways underlying complex disorders such as RSA (5, 6). An essential technique for analyzing gene expression patterns across several tissues or cellular types, such as the decidua and villus, which are crucial for the preservation of early pregnancy, is transcriptome analysis (7-9). Transcriptome analysis has emerged as a critical technique for investigating gene expression patterns in diverse tissues and cell types, including the decidua and villus, which are vital for sustaining early pregnancy. By combining information from multiple transcriptomic studies or datasets, in-silico transcriptome analysis enhances this method and provides a more thorough understanding of changes in gene expression. This integrative method facilitates the identification of shared molecular mechanisms, biomarkers, and biological pathways, yielding insights into potential treatment targets for RSA (10-12). Researchers can develop targeted treatments by gaining a comprehensive understanding of the complex molecular landscape associated with RSA through these advanced methodologies. In decidua and villus tissues from RSA patients, common differentially expressed genes (DEGs) are to be identified.
In this study, we integrated high-throughput RNA-seq datasets from decidua (GSE113790) and villus (GSE121950) tissues to perform a comprehensive bioinformatics analysis of RSA, a complex miscarriage disorder often linked to immune dysregulation at the maternal-fetal interface. After stringent batch correction using surrogate variable analysis (SVA) to mitigate technical variation, we identified DEGs with high confidence (|log₂FC| ≥ 2, false discovery rate [FDR] < 0.05). These DEGs were used to construct a high-confidence protein-protein interaction (PPI) network, followed by functional enrichment analysis to explore immune and extracellular matrix pathways. We then applied multiple centrality algorithms (maximum neighborhood component [MCC], density of maximum neighborhood component [DMNC], and maximal clique centrality [MNC]) to identify consensus hub genes and validate their expression across merged datasets. Finally, we highlighted NR4A1 and FOSB as key regulatory hubs and delineated targeted future directions, including experimental validation, single-cell profiling, mechanistic modelling, and cell functional assays, to clarify their mechanistic roles in RSA pathogenesis.
2. Materials and Methods
2.1. RNA sequencing data acquisition
In this bioinformatics study, 2 RNA sequencing datasets were collected from the gene expression omnibus (GEO) (13) database to examine DEGs in RSA. The datasets GSE113790 and GSE121950, both obtained from illumina HiSeq 2000 (Homo sapiens), comprised samples from decidua and villus tissues, respectively. GSE113790 comprised 6 decidua samples (3 from RSA patients and 3 from induced abortion controls), while GSE121950 included 6 villus samples (3 from RSA patients and 3 from controls). Data retrieval was executed utilizing the GEOquery package in R (version 4.3.1) (14). This study was conducted over 1 yr. Raw integer count matrices aligned to GRCh38.p13 and gene annotations were downloaded and merged with common gene IDs.
2.2. Batch correction using SVA
To adjust for hidden technical variation between datasets, SVAs were estimated using the SVA package svaseq, employing a full model including the biological group (RSA vs. control) and a reduced model excluding it (15). Genes with low mean (≤ 1) or zero variance were omitted before SVA to prevent density estimation errors. We retained the SV count to avoid overfitting. In addition, the ComBat function from the sva package was applied to reduce batch effects associated with the dataset origin. It should be noted that although the 2 integrated datasets (decidua and villus) represent distinct tissue types, there is currently no evidence indicating that these tissues are associated with distinct etiologies in RSA. Therefore, our analysis was designed to identify shared molecular signatures between decidua and villus tissues rather than to investigate tissue-specific effects. The batch correction was performed to minimize technical variation and enhance comparability across studies while preserving genuine biological signals related to RSA.
2.3. Evaluation of gene expression levels
Before conducting DEG analysis, low-count genes were filtered to include only those with at least 10 counts in the smallest sample group. Normalization and size-factor estimation (16) were performed using the DESeq2 default pipeline. DESeq2 (version 1.40.2) (17) was utilized to conduct differential expression analysis via the Wald test (17, 18), establishing statistical significance with an adjusted p < 0.05 (Benjamini-Hochberg) and |log2FoldChange| ≥ 2. Multiple-test corrections were performed using the FDR method (19). DEGs were ranked according to their significance, and those that met the criteria were classified as significant DEGs.
2.4. PPI network construction
A subset of 114 shared protein-coding DEGs was mapped to their corresponding STRING protein identifiers using STRING v12 (20). STRING consolidates established and anticipated interactions from multiple sources, encompassing genomic context, experimental data, co-expression, text mining, and pre-existing databases. A high-confidence PPI network was generated by restricting interactions to those with a combined confidence score > 0.7. Disconnected nodes without any retained interactions were removed to focus the analysis on the most relevant interaction module.
2.5. Functional enrichment analysis
The refined PPI network was analyzed for functional enrichment using the integrated STRING enrichment tool, employing default genome-wide background parameters and hypergeometric testing (21). Enrichment terms were considered statistically significant based on the following criteria: an FDR of ≤ 0.05, adjusted by the Benjamini-Hochberg procedure; a strength metric ≥ 0.25, defined as the log₁₀ ratio of observed to expected counts, representing the magnitude of fold enrichment; and a signal value ≥ 0.25, calculated as the harmonic mean of the enrichment strength and the negative logarithm of the FDR (-log₁₀ [FDR]), providing a balance between enrichment magnitude and statistical confidence. Annotation terms included “count in network/background”, indicating how many of our DEG proteins matched the term vs. the total annotated proteins, providing both specificity and coverage information.
2.6. Hub gene identification
To pinpoint the most central regulators within the refined PPI network, hub genes were identified through the CytoHubba (22) plugin in Cytoscape (version 2.10.2) (23), a bioinformatics platform that facilitates the visualization of molecular interaction networks and the integration of diverse data types, such as gene expression profiles. CytoHubba facilitates the analysis of biological networks by identifying critical nodes, such as proteins or genes, using topological algorithms. This study employed 3 complementary metrics: MCC which measures the number and size of maximal cliques that include a given node; nodes within large, dense cliques are prioritized, making MCC one of the most accurate predictors of essential proteins. DMNC, which scores nodes based on the density of their most well-connected neighbors, helping uncover embedded hub modules that may not have the highest degree, and MNC, which quantifies the size of the most significant connected component in a node’s immediate neighborhood, effectively evaluating local connectivity without clique-level density. The top 10 genes from each ranking method were selected, and consensus hub genes were defined as those familiar across all 3 lists, thereby enhancing robustness through cross-validation across multiple centrality perspectives.
2.7. Gene xxpression visualization and network analysis
After merging normalized count data from both GSE113790 and GSE121950 into a single unified dataset, we plotted boxplots for the hub genes NR4A1 and FOSB using the combined data matrix. These plots, showing median, interquartile ranges, and outliers, contrast RSA vs. control across all samples (decidua and villus), highlighting consistent gene expression differences in the merged dataset context.
All differential expression statistics were computed using DESeq2 (v1.40.2), applying the Wald test and standard normalization procedures. Genes were defined as significantly differentially expressed with |log₂FoldChange| ≥ 2 and an adjusted p < 0.05 (Benjamini-Hochberg FDR correction).
2.8. Ethical Considerations
This study was supported by Neyshabur University of Medical Sciences, Neyshabur, Iran (Code: IR.NUMS.REC.1402.002), and also by the Guilan University of Medical Sciences, Rasht, Iran.
3. Results
3.1. Batch effect identification
Uncorrected principal component analysis (PCA) revealed sample clustering predominantly by dataset rather than biological group, confirming inter-study batch effects. After incorporating study and SV covariates into the design, PCA axes clearly separated samples by RSA status, confirming that batch effects were effectively accounted for (Figure 1).
3.2. DEGs
Post-batch-correction DESeq2 analysis identified 138 differentially expressed RNAs across the combined decidua and villus datasets. These included 13 non-coding RNAs, 114 protein-coding genes (DEGs), 3 pseudogenes, 4 ribosomal RNAs (rRNAs), and one small cytoplasmic RNA. For downstream analyses, only 114 protein-coding DEGs were retained. Among these, 30 genes were upregulated and 84 were downregulated in RSA samples compared to controls (Figure 2).
3.3. Analysis of PPI networks
To explore the functional associations among the identified differentially expressed protein-coding genes, a PPI network was constructed using the STRING database with a high-confidence interaction score threshold. After removing disconnected nodes, the resulting core network comprised 101 nodes and 116 edges, with an average node degree of 2.3. Notably, the PPI enrichment p < 1.0e-16, indicating that the observed network exhibits significantly more interactions than expected by chance for a random set of proteins of similar size and degree distribution. This enrichment strongly suggests that the proteins are not acting independently but are functionally associated, implying their participation in standard biological processes (BP) relevant to RSA pathophysiology (Figure 3).
3.4. Functional enrichment of the PPI network
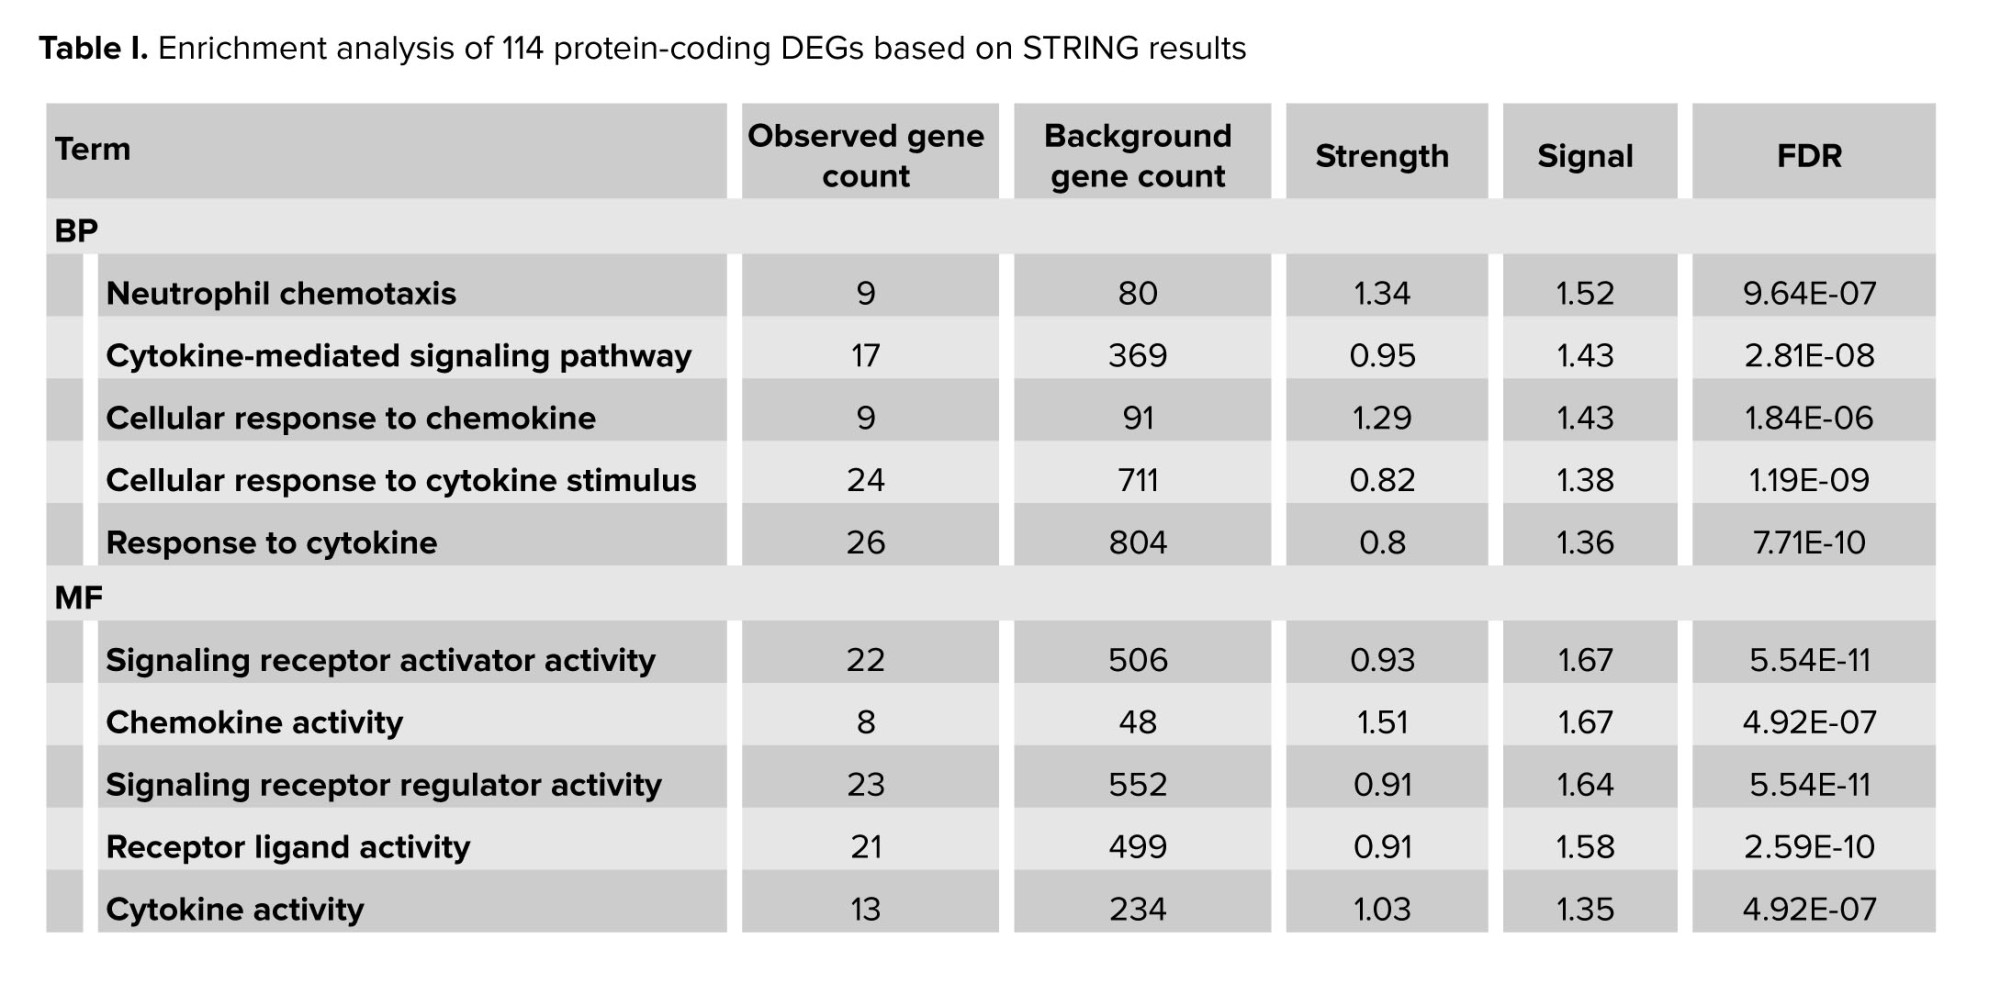
STRING-based enrichment analysis revealed multiple gene ontology (GO) terms across BP, molecular functions (MF), and cellular components (CC) that satisfied the predefined significance thresholds (FDR ≤ 0.05, strength ≥ 0.25, signal ≥ 0.25) (Figure 4). Notable enriched terms include (Table I):
- Neutrophil chemotaxis (BP): strength = 1.34, signal = 1.52, FDR = 9.64 × 10⁻⁷
- Cytokine-mediated signaling pathway (BP): strength = 0.95, signal = 1.43, FDR = 2.81 × 10⁻⁸
- Cellular response to cytokine stimulus (BP): strength = 0.82, signal = 1.38, FDR = 1.19 × 10⁻⁹
- Signaling receptor activator activity (MF): strength = 0.93, signal = 1.67, FDR = 5.54 × 10⁻¹¹
- Chemokine activity (MF): strength = 1.51, signal = 1.67, FDR = 4.92 × 10⁻⁷
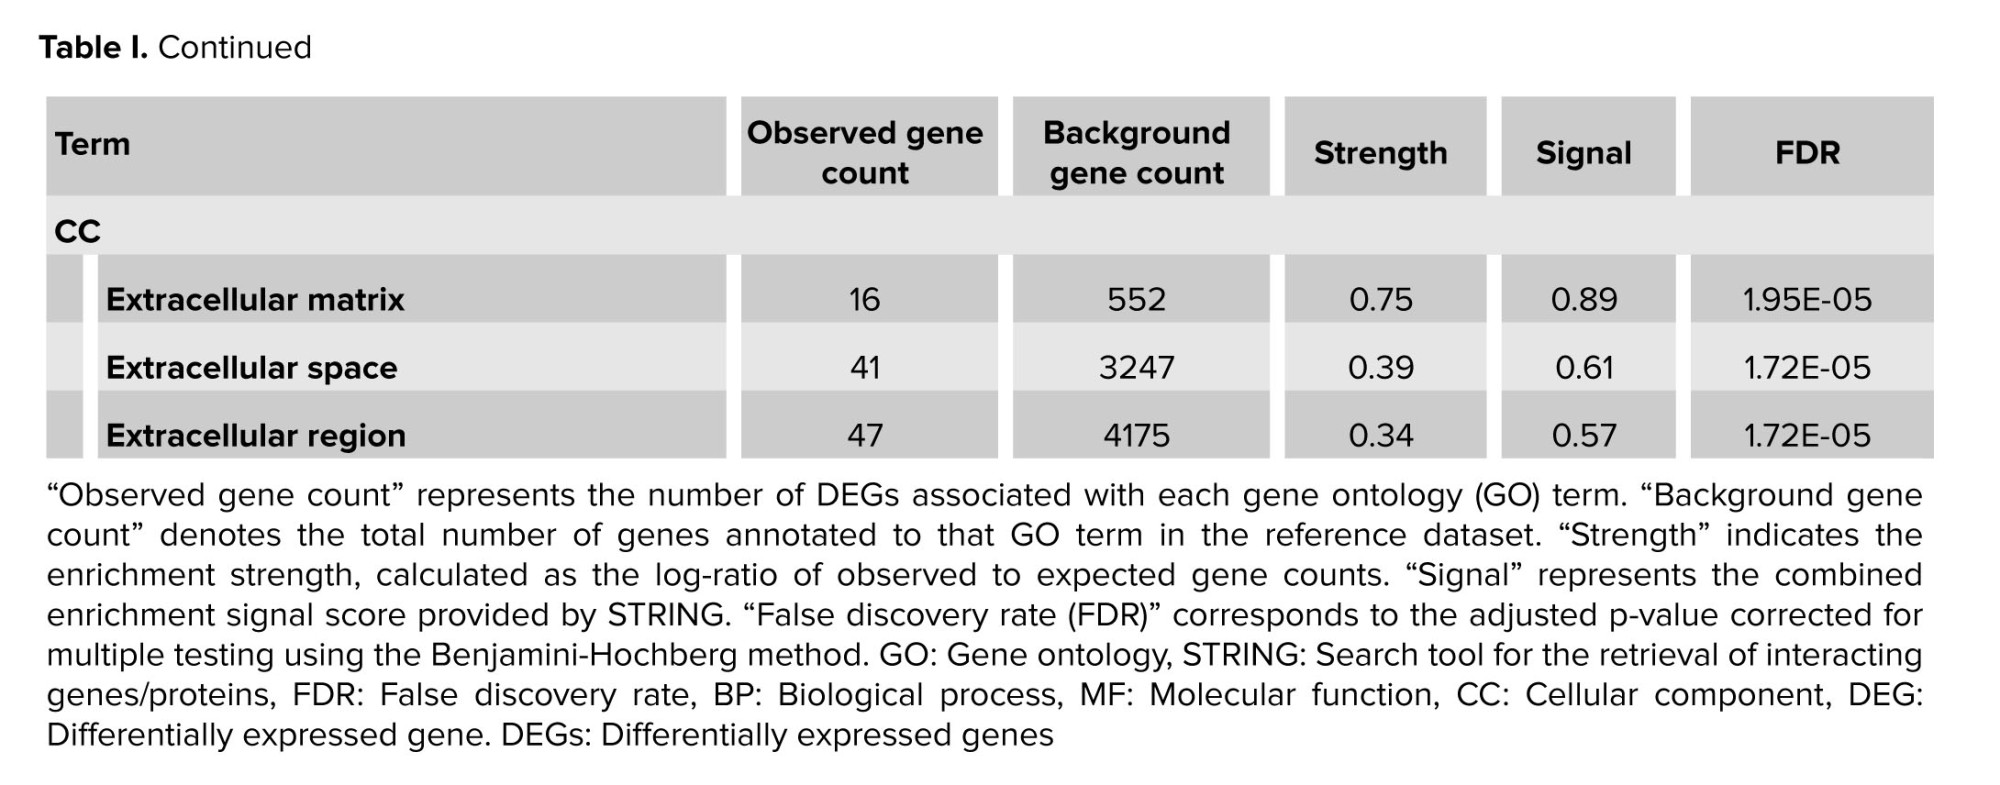
- Extracellular matrix (CC): strength = 0.75, signal = 0.89, FDR = 1.95 × 10⁻⁵
- Extracellular space (CC): strength = 0.39, signal = 0.61, FDR = 1.72 × 10⁻⁵
These enriched terms indicate significant involvement of immune-related processes, including chemotaxis, cytokine-mediated signaling, and extracellular matrix organization. The enrichment metrics attest to the statistical robustness and biological relevance of these findings, aligning with mechanisms previously implicated in RSA.
This table summarizes significantly enriched functional categories identified through STRING’s enrichment pipeline, using stringent filters: FDR ≤ 0.05, strength ≥ 0.25, and signal ≥ 0.25. The term column classifies each entry as a GOBP, molecular function (MF), or cellular component (CC). Term description provides the specific functional annotation. Observed gene count is the number of DEGs annotated to that term, while background gene count indicates the total genes annotated to the term in the STRING species-wide background. The strength column shows the log₁₀-fold enrichment ratio (observed/expected), and signal combines strength with statistical confidence (a harmonic mean of strength and –log₁₀[FDR]). Finally, the FDR represents the FDR-adjusted p-value from STRING’s hypergeometric enrichment test. These metrics collectively provide a robust, multi-dimensional view of functional over-representation among DEGs in RSA (Table I).
3.5. Hub gene analysis
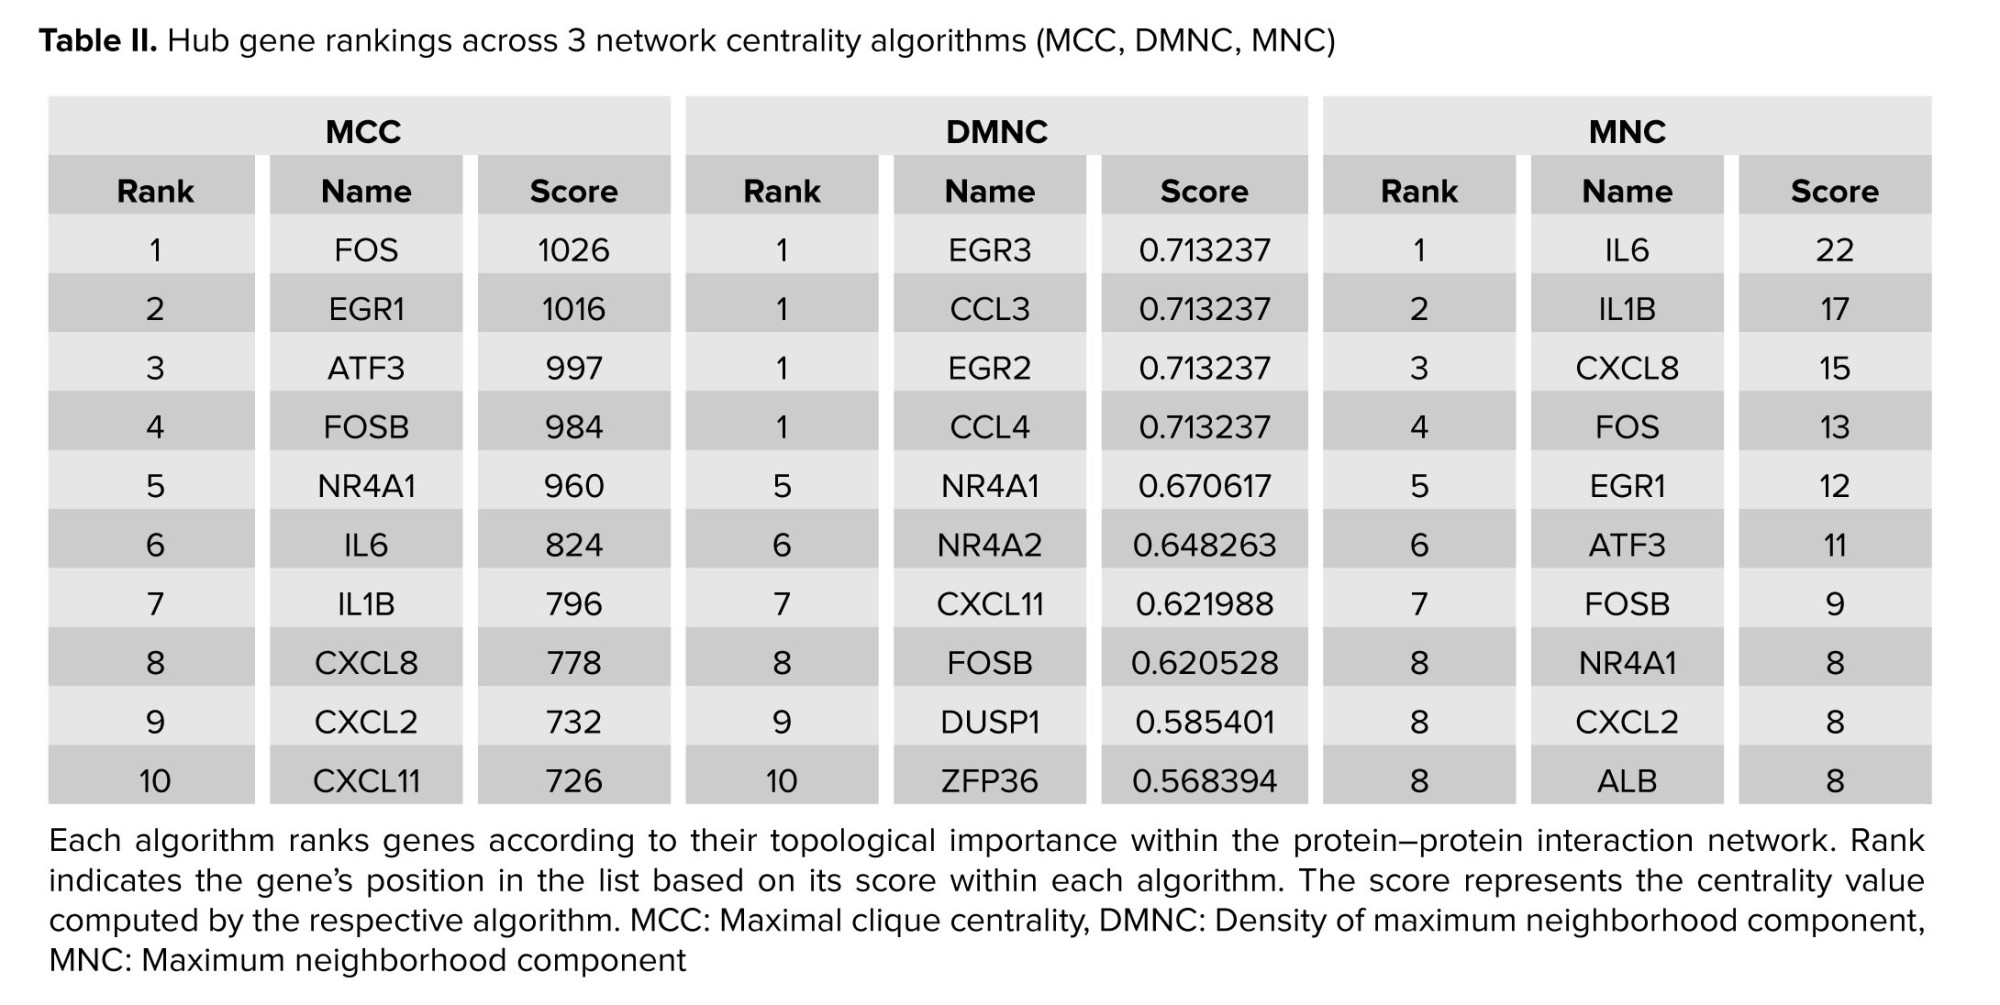
Application of MCC, DMNC, and MNC algorithms yielded 3 ranked lists of the top 10 hub proteins each (Table II). 2 genes, NR4A1 and FOSB, were common to all 3 methods, indicating their exceptionally high centrality across diverse centrality measures. These consensus hub genes, owing to their prominent network positions, are strong candidates for key regulatory roles in RSA-related molecular pathways and warrant focused experimental follow‑up (Figure 5).
The rank column indicates each gene’s position in the top 10 list for each method, the name column specifies the hub candidate, and the score column displays its algorithm-specific centrality value (Table II).
3.6. Hub gene assessment
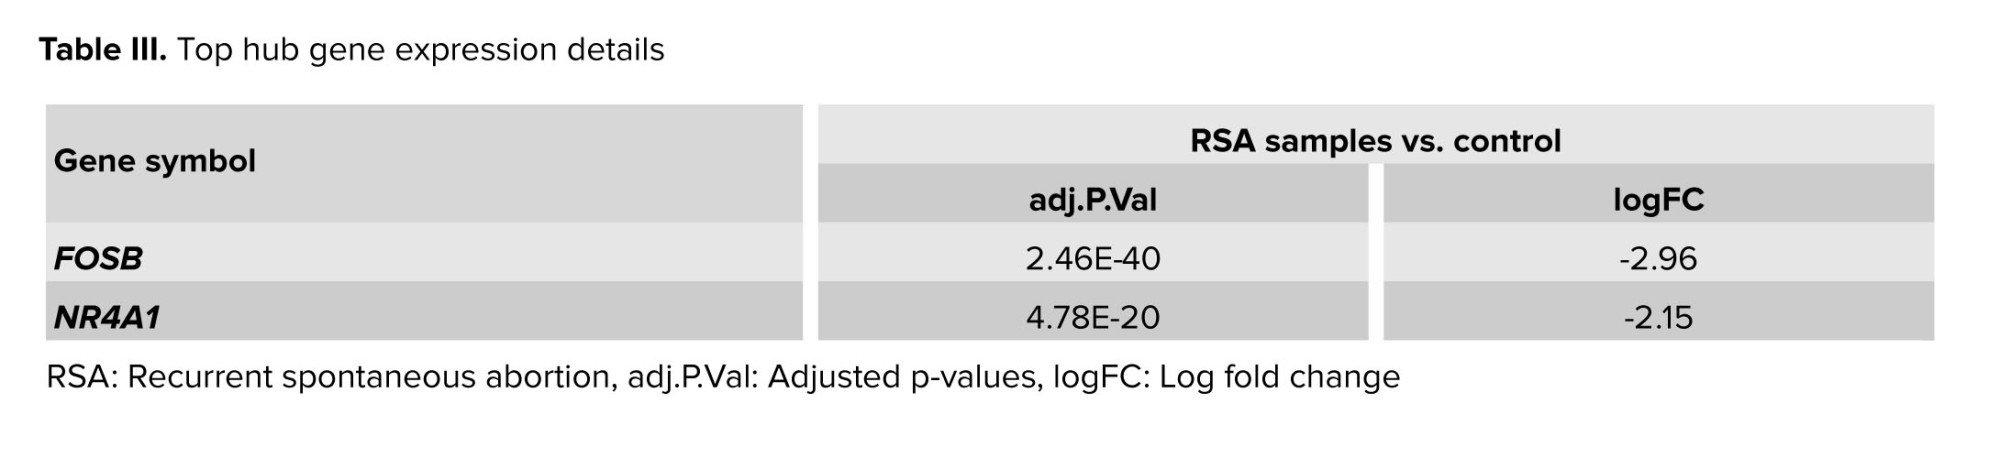
The 2 hub genes, FOSB and NR4A1, were significantly downregulated in the merged datasets GSE113790 and GSE121950 (Table III). Specifically, FOSB showed an adjusted p-value of 2.46E-40 and a logFC of -2.96, and NR4A1 showed adjusted p-values of 4.78E-20 and a matching logFC value of -2.15 (Figure 6).
4. Discussion
114 protein-coding DEGs were found in decidua and villus samples from RSA patients as compared to controls in this integrative bioinformatics investigation. Reliable downstream analyses were made possible by robust batch correction utilizing SVA, which successfully decreased technical variation and recovered the underlying biological signal. The high-confidence PPI network revealed significant interaction enrichment (p < 1×10⁻¹⁶), supporting functional association among DEGs. Functional enrichment emphasized immune-related processes- neutrophil chemotaxis, cytokine signaling, chemokine activity, and extracellular matrix/space involvement. Notably, 2 hub genes, NR4A1 and FOSB, emerged consistently across MCC, DMNC, and MNC centrality measures, and were significantly downregulated in RSA (FOSB log2FC = -2.96, p_adj = 2.46×10⁻⁴⁰; NR4A1 log2FC = -2.15, p_adj = 4.78×10⁻²⁰).
The identification of 138 differentially expressed RNAs, particularly the 114 protein-coding DEGs showing predominant downregulation (84/114 genes), aligns with established evidence of transcriptional suppression in RSA. The PPI network enrichment (p < 1.0e-16) and functional annotations strongly implicate dysregulated immune processes, including: neutrophil chemotaxis (strength = 1.34, FDR = 9.64 × 10⁻⁷), cytokine-mediated signaling (strength = 0.95, FDR = 2.81 × 10⁻⁸), and extracellular matrix organization (strength = 0.75, FDR = 1.95 × 10⁻⁵). These pathways reflect compromised maternal-fetal immune tolerance- a hallmark of RSA pathogenesis (24, 25). The enrichment of chemokine activity and extracellular space terms further suggests altered leukocyte recruitment and tissue remodeling, consistent with histological studies showing aberrant decidual immune cell infiltration in RSA patients (26).
Notably, the consensus hub genes NR4A1 and FOSB (log₂FC = -2.15 and -2.96, respectively) emerged as central network regulators. Both are immediate-early transcription factors regulating inflammation and apoptosis. FOSB and NR4A1 are associated with stress responses and immune regulation (27, 28), which are essential during pregnancy for maintaining the immune tolerance of the fetus (29-33). NR4A1 is a nuclear receptor implicated in immune homeostasis, T-cell regulation, and apoptosis. Its downregulation may contribute to disturbed immune tolerance or inadequate regulation of decidual inflammatory responses. FOSB, a transcriptional regulator in the AP-1 family, influences cellular differentiation and cytokine responses; reduced FOSB expression may impede angiogenesis or trophoblast function by dysregulating gene expression. Also, the FOS gene participates in transcriptional control associated with cellular stress responses and immunological adaptation during pregnancy; its altered expression can impair immune tolerance to the fetus (23). The NR4A1 gene is linked to hormone receptor signaling and immune regulation, influencing trophoblast differentiation and maternal-fetal interface adaptation.
This study reinforces the critical role of immune and inflammatory imbalance in RSA. The enrichment of neutrophil chemotaxis and cytokine-mediated signaling mirrors known RSA-associated Th1/Th17 dysregulation (24, 34-36). The downregulation of NR4A1 and FOSB suggests impaired regulatory circuits that control inflammation, cell survival, and tissue remodeling, a fresh insight into RSA etiology. Identifying these genes as central hubs suggests they may function as keystone regulators worth further investigation.
This study integrated 2 complementary RNA-sequencing datasets (decidua and villus) to identify shared molecular mechanisms in RSA. Rigorous batch correction using SVA successfully minimized study-specific variation, as shown by PCA clustering that reflected biological rather than technical differences. DEGs were detected using conservative thresholds (|log₂FC| ≥ 2, FDR < 0.05), ensuring high-confidence results. A high-confidence PPI network was constructed through STRING (score > 0.7), followed by functional enrichment and multi-algorithm hub gene analysis. Cross-validation across 3 centrality measures (MCC, DMNC, and MNC) consistently identified NR4A1 and FOSB as key regulators, underscoring their potential roles in RSA pathogenesis.
Nevertheless, several limitations should be acknowledged. The modest cohort size (n = 6 per group) may limit the detection of subtle transcriptional changes, and the analysis was conducted entirely in silico without external or experimental validation. The scarcity and heterogeneity of available RSA datasets further restrict direct replication. In addition, integrating decidua and villus data may obscure tissue-specific signals.
Overall, this work should be viewed as exploratory and hypothetical. Future research should validate candidate hub genes (NR4A1 and FOSB) in larger, independent cohorts using real time- qualitative polymerase chain reaction, Western blotting, and immunohistochemistry. Functional studies in trophoblast and decidual stromal cells, complemented by single-cell RNA-seq, co-culture, and animal models, will be essential to clarify their mechanistic roles in immune regulation, apoptosis, and pregnancy maintenance.
5. Conclusion
Our bioinformatics analysis supports the idea that immune imbalance, particularly involving chemotaxis and cytokine signaling, is at the core of RSA. Hub genes NR4A1 and FOSB, consistently downregulated and centrally located in PPI networks, emerge as compelling regulators of RSA pathophysiology. Following validation, these genes may offer novel diagnostic or therapeutic targets to improve the management of RSA.
Data Availability
We have all the details of the data availability. Upon a reasonable request, the author will provide all data.
Author Contributions
K. Babaei, S. Morovat, and E. Mirzajani were involved in the investigation, methodology, and the comprehensive writing of the primary draft of the manuscript. H. Mozdarani, M. Naghdipour Mirsadeghi, and SR. Mirhafez were engaged in different parts of this manuscript. M. Aziminezhad and AA. Samadani were involved in supervision, reviewing, editing, and conceptualization. All the authors studied the final edited version of the manuscript and confirmed this.
Meanwhile, this manuscript was extracted from a Ph.D. dissertation and because of those 2 supervisors, there are 2 corresponding authors.
Acknowledgments
The authors express their gratitude to all the people who assisted and contributed to this research project. Importantly, we would like to thank the authors of valuable public resources, including the GEO, Gepia2, Cytoscape, GO, and Gene-MANIA databases. We did not use any artificial intelligence (translation, revision, grammar check, etc.).
Conflict of Interest
The authors declare that there is no conflict of interest.
This table summarizes significantly enriched functional categories identified through STRING’s enrichment pipeline, using stringent filters: FDR ≤ 0.05, strength ≥ 0.25, and signal ≥ 0.25. The term column classifies each entry as a GOBP, molecular function (MF), or cellular component (CC). Term description provides the specific functional annotation. Observed gene count is the number of DEGs annotated to that term, while background gene count indicates the total genes annotated to the term in the STRING species-wide background. The strength column shows the log₁₀-fold enrichment ratio (observed/expected), and signal combines strength with statistical confidence (a harmonic mean of strength and –log₁₀[FDR]). Finally, the FDR represents the FDR-adjusted p-value from STRING’s hypergeometric enrichment test. These metrics collectively provide a robust, multi-dimensional view of functional over-representation among DEGs in RSA (Table I).
3.5. Hub gene analysis
Application of MCC, DMNC, and MNC algorithms yielded 3 ranked lists of the top 10 hub proteins each (Table II). 2 genes, NR4A1 and FOSB, were common to all 3 methods, indicating their exceptionally high centrality across diverse centrality measures. These consensus hub genes, owing to their prominent network positions, are strong candidates for key regulatory roles in RSA-related molecular pathways and warrant focused experimental follow‑up (Figure 5).
The rank column indicates each gene’s position in the top 10 list for each method, the name column specifies the hub candidate, and the score column displays its algorithm-specific centrality value (Table II).
3.6. Hub gene assessment
The 2 hub genes, FOSB and NR4A1, were significantly downregulated in the merged datasets GSE113790 and GSE121950 (Table III). Specifically, FOSB showed an adjusted p-value of 2.46E-40 and a logFC of -2.96, and NR4A1 showed adjusted p-values of 4.78E-20 and a matching logFC value of -2.15 (Figure 6).
4. Discussion
114 protein-coding DEGs were found in decidua and villus samples from RSA patients as compared to controls in this integrative bioinformatics investigation. Reliable downstream analyses were made possible by robust batch correction utilizing SVA, which successfully decreased technical variation and recovered the underlying biological signal. The high-confidence PPI network revealed significant interaction enrichment (p < 1×10⁻¹⁶), supporting functional association among DEGs. Functional enrichment emphasized immune-related processes- neutrophil chemotaxis, cytokine signaling, chemokine activity, and extracellular matrix/space involvement. Notably, 2 hub genes, NR4A1 and FOSB, emerged consistently across MCC, DMNC, and MNC centrality measures, and were significantly downregulated in RSA (FOSB log2FC = -2.96, p_adj = 2.46×10⁻⁴⁰; NR4A1 log2FC = -2.15, p_adj = 4.78×10⁻²⁰).
The identification of 138 differentially expressed RNAs, particularly the 114 protein-coding DEGs showing predominant downregulation (84/114 genes), aligns with established evidence of transcriptional suppression in RSA. The PPI network enrichment (p < 1.0e-16) and functional annotations strongly implicate dysregulated immune processes, including: neutrophil chemotaxis (strength = 1.34, FDR = 9.64 × 10⁻⁷), cytokine-mediated signaling (strength = 0.95, FDR = 2.81 × 10⁻⁸), and extracellular matrix organization (strength = 0.75, FDR = 1.95 × 10⁻⁵). These pathways reflect compromised maternal-fetal immune tolerance- a hallmark of RSA pathogenesis (24, 25). The enrichment of chemokine activity and extracellular space terms further suggests altered leukocyte recruitment and tissue remodeling, consistent with histological studies showing aberrant decidual immune cell infiltration in RSA patients (26).
Notably, the consensus hub genes NR4A1 and FOSB (log₂FC = -2.15 and -2.96, respectively) emerged as central network regulators. Both are immediate-early transcription factors regulating inflammation and apoptosis. FOSB and NR4A1 are associated with stress responses and immune regulation (27, 28), which are essential during pregnancy for maintaining the immune tolerance of the fetus (29-33). NR4A1 is a nuclear receptor implicated in immune homeostasis, T-cell regulation, and apoptosis. Its downregulation may contribute to disturbed immune tolerance or inadequate regulation of decidual inflammatory responses. FOSB, a transcriptional regulator in the AP-1 family, influences cellular differentiation and cytokine responses; reduced FOSB expression may impede angiogenesis or trophoblast function by dysregulating gene expression. Also, the FOS gene participates in transcriptional control associated with cellular stress responses and immunological adaptation during pregnancy; its altered expression can impair immune tolerance to the fetus (23). The NR4A1 gene is linked to hormone receptor signaling and immune regulation, influencing trophoblast differentiation and maternal-fetal interface adaptation.
This study reinforces the critical role of immune and inflammatory imbalance in RSA. The enrichment of neutrophil chemotaxis and cytokine-mediated signaling mirrors known RSA-associated Th1/Th17 dysregulation (24, 34-36). The downregulation of NR4A1 and FOSB suggests impaired regulatory circuits that control inflammation, cell survival, and tissue remodeling, a fresh insight into RSA etiology. Identifying these genes as central hubs suggests they may function as keystone regulators worth further investigation.
This study integrated 2 complementary RNA-sequencing datasets (decidua and villus) to identify shared molecular mechanisms in RSA. Rigorous batch correction using SVA successfully minimized study-specific variation, as shown by PCA clustering that reflected biological rather than technical differences. DEGs were detected using conservative thresholds (|log₂FC| ≥ 2, FDR < 0.05), ensuring high-confidence results. A high-confidence PPI network was constructed through STRING (score > 0.7), followed by functional enrichment and multi-algorithm hub gene analysis. Cross-validation across 3 centrality measures (MCC, DMNC, and MNC) consistently identified NR4A1 and FOSB as key regulators, underscoring their potential roles in RSA pathogenesis.
Nevertheless, several limitations should be acknowledged. The modest cohort size (n = 6 per group) may limit the detection of subtle transcriptional changes, and the analysis was conducted entirely in silico without external or experimental validation. The scarcity and heterogeneity of available RSA datasets further restrict direct replication. In addition, integrating decidua and villus data may obscure tissue-specific signals.
Overall, this work should be viewed as exploratory and hypothetical. Future research should validate candidate hub genes (NR4A1 and FOSB) in larger, independent cohorts using real time- qualitative polymerase chain reaction, Western blotting, and immunohistochemistry. Functional studies in trophoblast and decidual stromal cells, complemented by single-cell RNA-seq, co-culture, and animal models, will be essential to clarify their mechanistic roles in immune regulation, apoptosis, and pregnancy maintenance.
5. Conclusion
Our bioinformatics analysis supports the idea that immune imbalance, particularly involving chemotaxis and cytokine signaling, is at the core of RSA. Hub genes NR4A1 and FOSB, consistently downregulated and centrally located in PPI networks, emerge as compelling regulators of RSA pathophysiology. Following validation, these genes may offer novel diagnostic or therapeutic targets to improve the management of RSA.
Data Availability
We have all the details of the data availability. Upon a reasonable request, the author will provide all data.
Author Contributions
K. Babaei, S. Morovat, and E. Mirzajani were involved in the investigation, methodology, and the comprehensive writing of the primary draft of the manuscript. H. Mozdarani, M. Naghdipour Mirsadeghi, and SR. Mirhafez were engaged in different parts of this manuscript. M. Aziminezhad and AA. Samadani were involved in supervision, reviewing, editing, and conceptualization. All the authors studied the final edited version of the manuscript and confirmed this.
Meanwhile, this manuscript was extracted from a Ph.D. dissertation and because of those 2 supervisors, there are 2 corresponding authors.
Acknowledgments
The authors express their gratitude to all the people who assisted and contributed to this research project. Importantly, we would like to thank the authors of valuable public resources, including the GEO, Gepia2, Cytoscape, GO, and Gene-MANIA databases. We did not use any artificial intelligence (translation, revision, grammar check, etc.).
Conflict of Interest
The authors declare that there is no conflict of interest.
Type of Study: Original Article |
Subject:
Fertility & Infertility
Send email to the article author
| Rights and permissions | |
 |
This work is licensed under a Creative Commons Attribution-NonCommercial 4.0 International License. |